Asian countries account for at least 40% of the value of merchandise exports, and 35% of the value of global merchandise imports - both roughly equates to 25 trillion/year globally. The annual weighted average growth rates for both exports and imports show the robustness of the region in terms of trade. In terms of merchandise exports, the data from WTO shows that Asia registered an increase of almost 14% (2021-2022) while the other countries have grown at less than 9%. In terms of merchandise imports, Asia grew more than 14%, while the others have grown at 13% during the same period.
Rising sea levels, stronger storms, and heavier rainfall are threatening the very infrastructure that keeps trade moving. In many parts of Asia, key ports are at risk of annual disruption, costing millions in damage and delays. Some airports may face regular shutdowns due to flooding. Road and rail networks are increasingly exposed to extreme precipitation, especially under high-emissions scenarios like RCP 8.5 by mid-century.
Asia's share in the estimated exposed rail and road assets (km) under the said RCP scenario is 40%. In terms of ports, Asia bears 45% of the value of physical damages and the value of trade expected to be disrupted by natural hazards and maritime extreme events. Asia also bears an overwhelming 87% of the estimated airport disruptions due to sea level rise.
This tool tries to provide insights that combines trade related data and data related to risks brought about by climate change and other environmental events to transport systems and components. By combining trade cost data from UNCTAD and the World Bank with risk and resilience indicators from various sources, as collated and organized by the Asian Transport Observatory, this tool gives a clearer picture of which routes are vulnerable—and what's at stake. It shows not just how goods move, but also what risks are faced by the transportation systems. This matters for planners, investors, and governments alike. Trade is only as resilient as the systems and infrastructure that supports it.
See notes below for further details
Instructions
This tool allows you to combine trade-related indicators with climate/multi-hazard risk indicators between selected country pairs.
User Panel
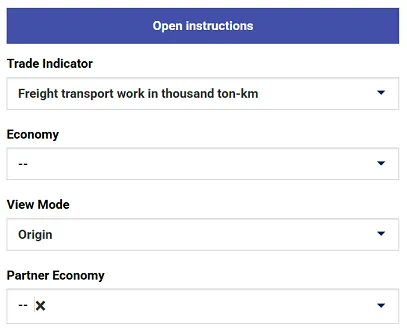
- Select one of the trade indicators under "Trade Indicator."
- Go to the users' panel and select your main economy of interest. For example, select "Philippines."
- Under the "View Mode" you can define whether the selected economy is the origin or destination of trade.
- You can type in multiple (maximum of 15) partner economies under "Partner economy." If you leave it blank, by default, the map and tables will show the top 15 partner economies based on the trade indicator of interest. In cases where the map does not show flow lines, it means that data is not available for the selected country pair-indicator combination.
Map
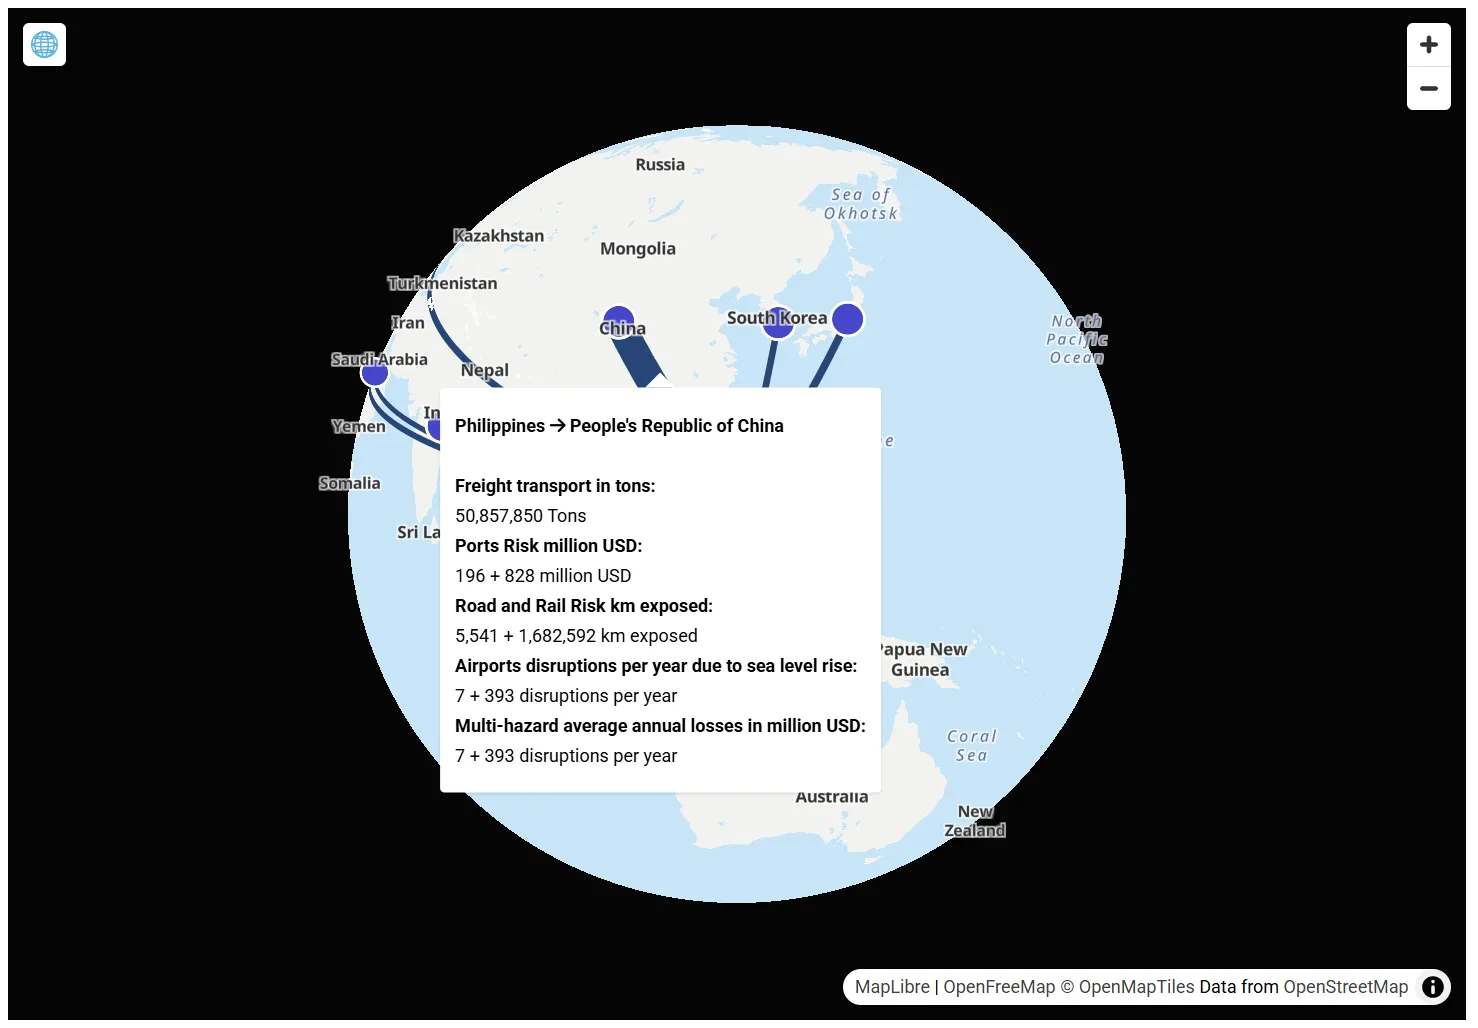
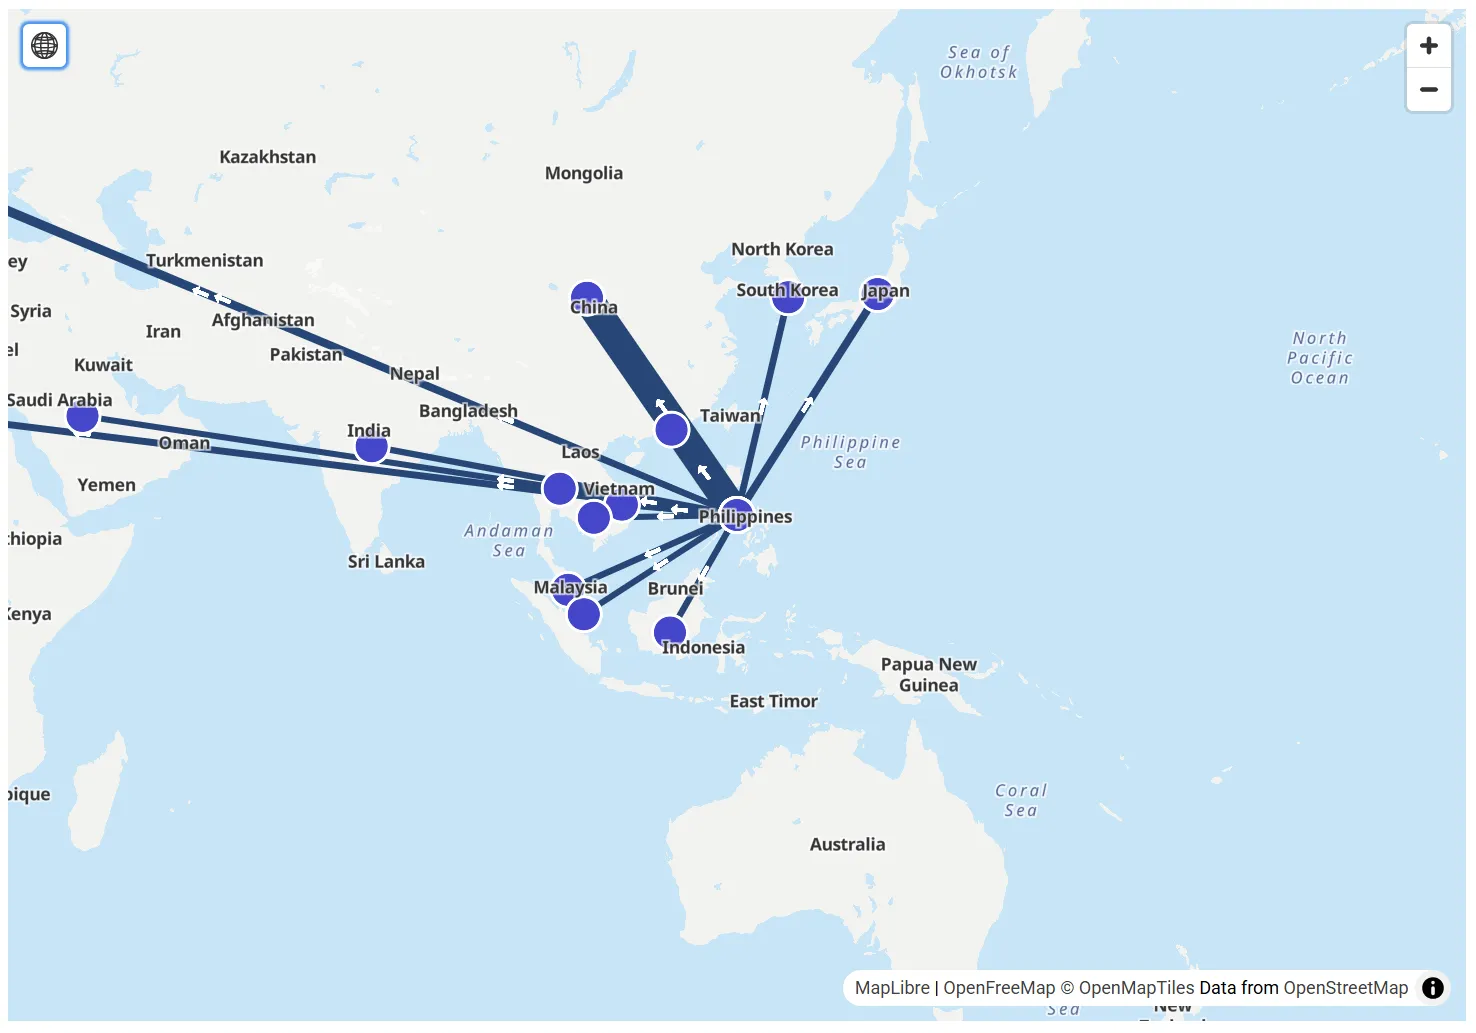
Once you had filled in the information, the tool will automatically map the country pairs and the values for the selected trade indicator and summaries for the risk-related indicators. Please note that the values are for the year 2021.
- You can zoom in and out using the + and - signs at the upper-right corner of the map tool. You can also use the scroll wheel of your mouse, if available.
- You can hover through the lines and see the summary information for each of the country pairs, including the risk-related indicators.
- You can click on the globe icon on the upper left corner of the map to switch between the globe and flat map views.
Summary Tables and Figures
You can view the summary of the values through the table below the map. The table show either the top 15 countries (if no selection is manually inputted) or the list of the countries selected (together with the main one). It combines the trade-related indicator as well as the values for the "risk-related indicators" that had been pre-chosen by the ATO.
The risk-related indicators are provided for each of the countries in the selected pairs (just to show instances where data is not available). For example, the table below shows that the Road and Rail Risk (km exposed) for Philippines (origin) and Hong Kong, China (destination) is 5,541 km for the Philippines, and NaN for Hong Kong, China (which means that data is not available from the source data set).
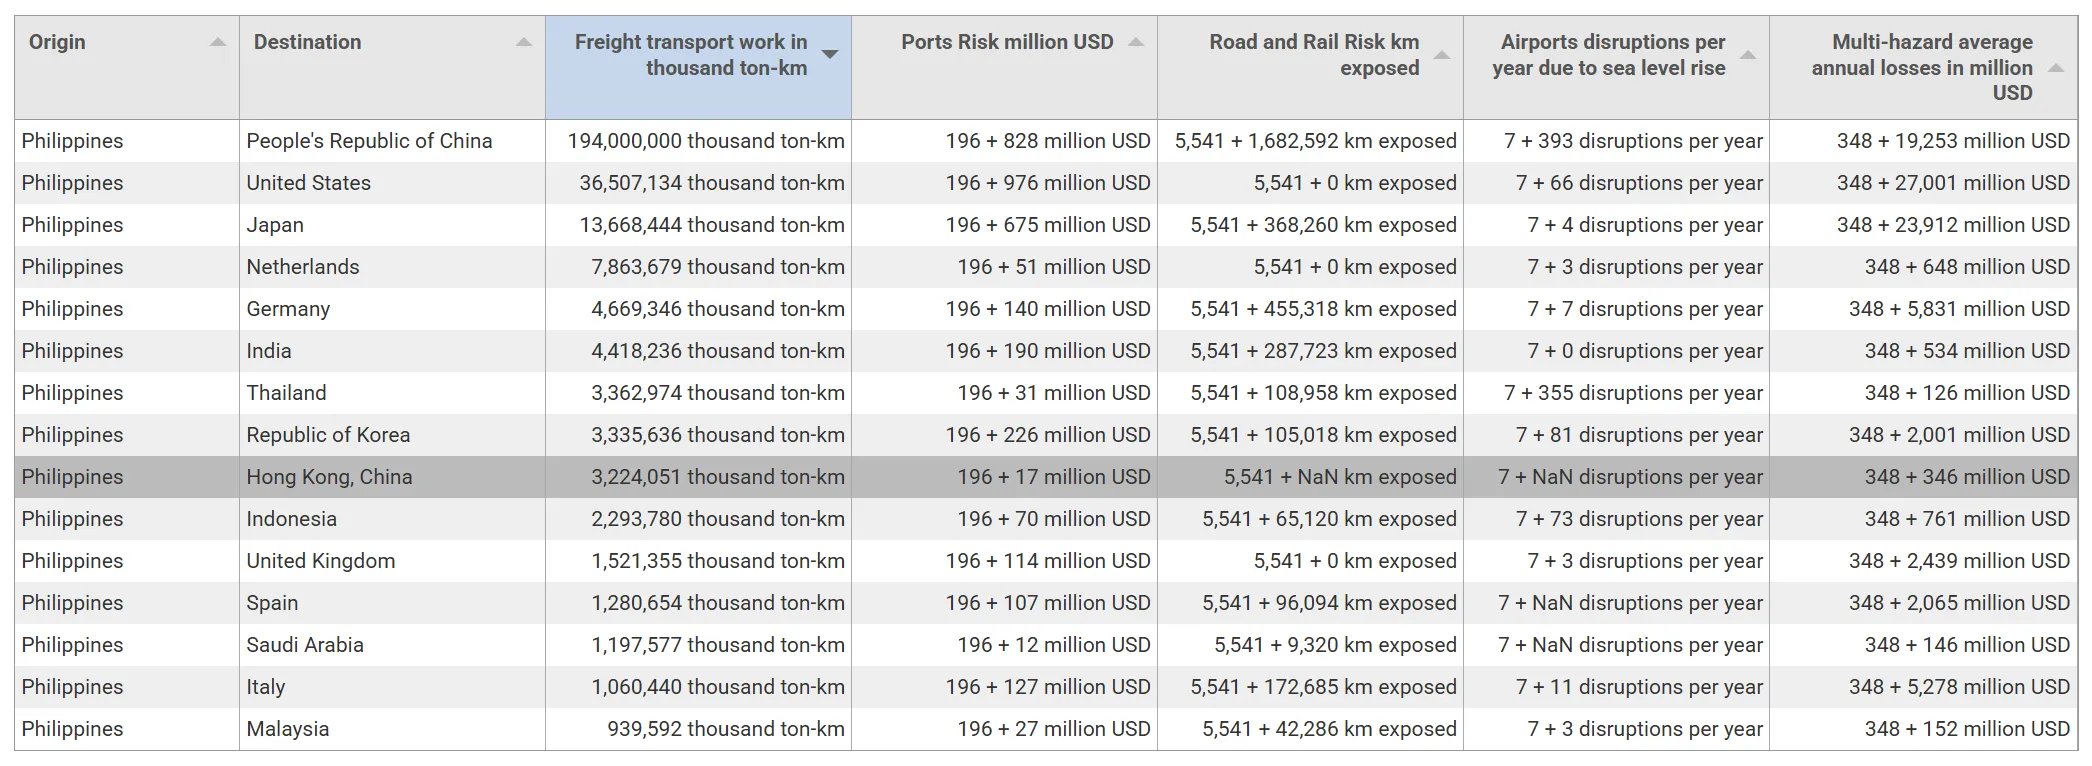
You can also sort the values based on the columns, just click the arrow button of the column which you would like to use for sorting the values.
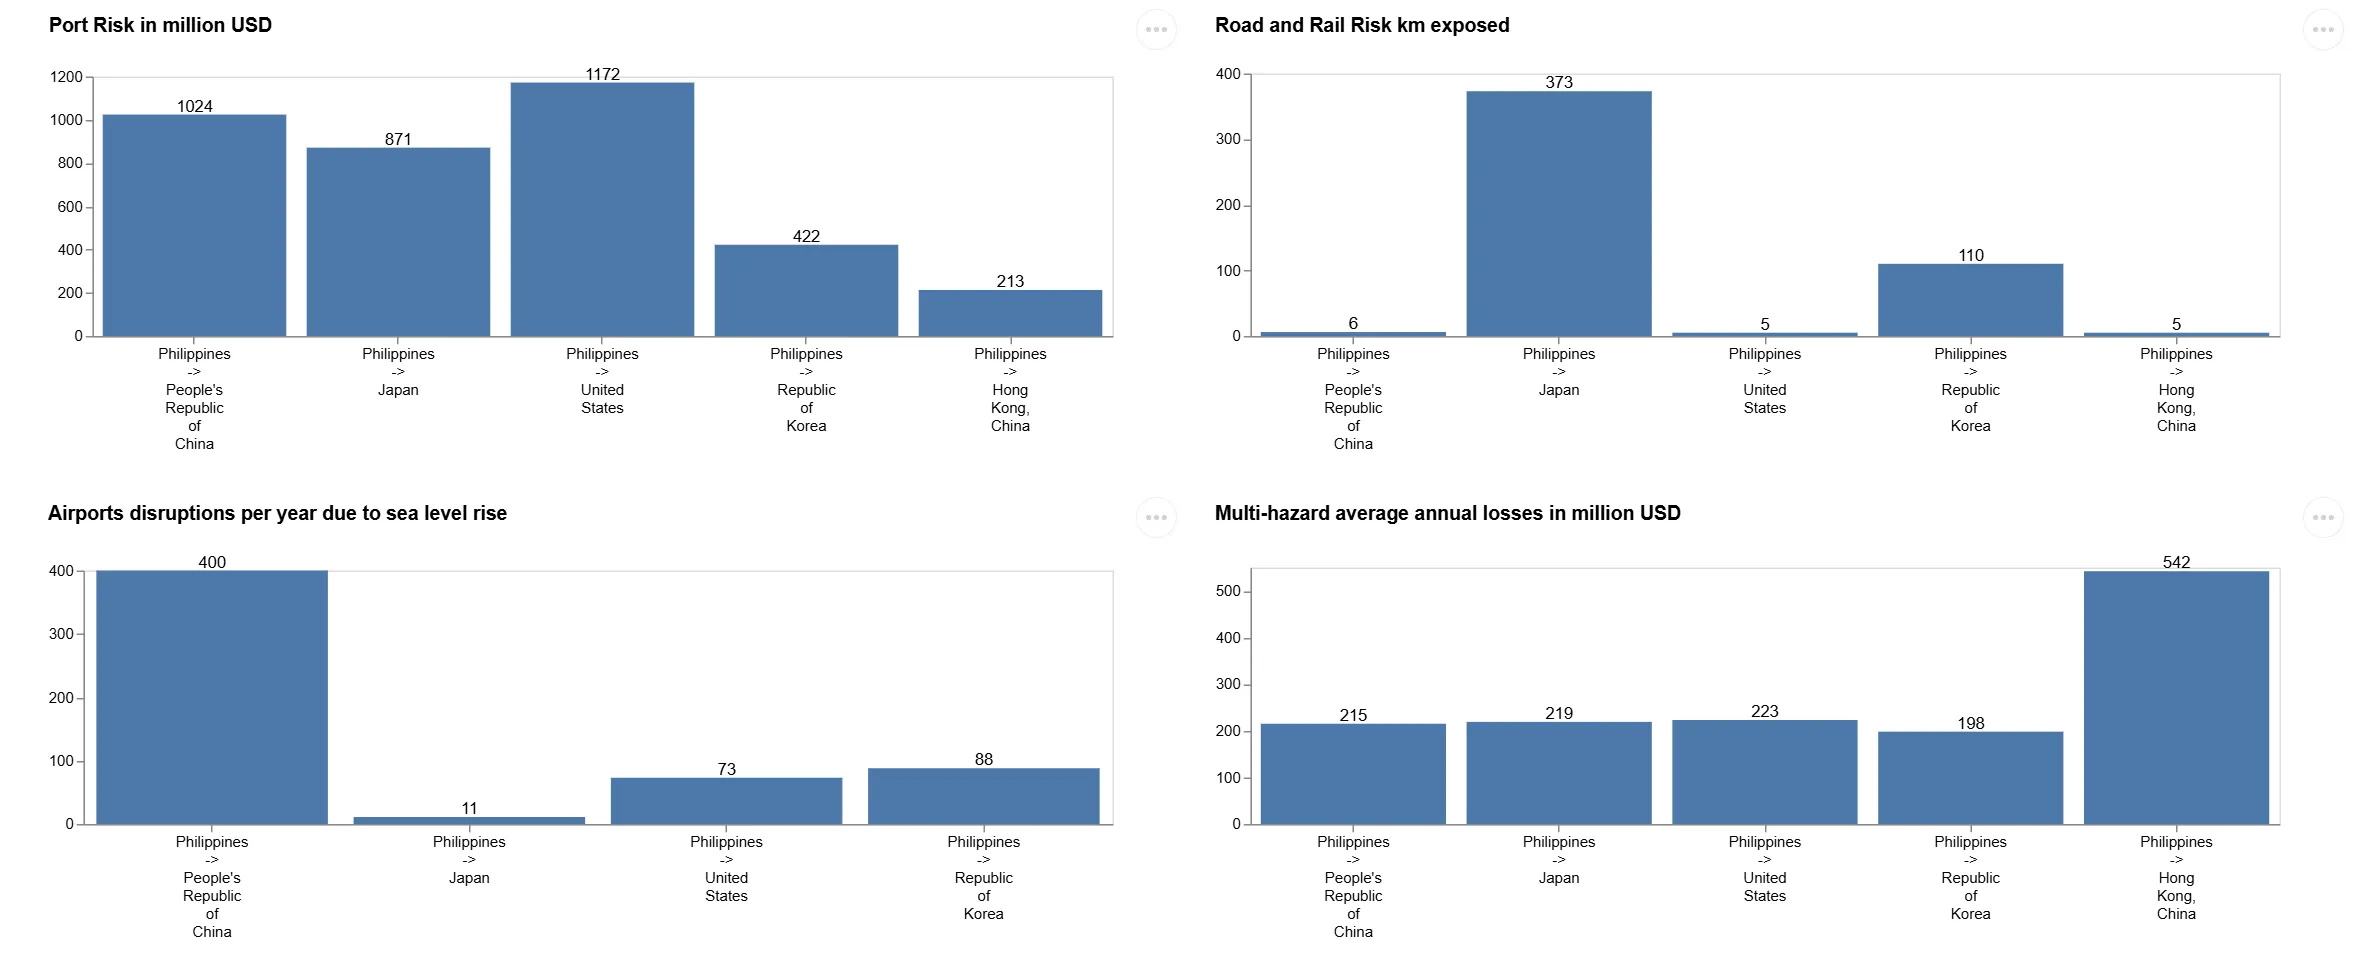
Finally, summary graphs are provided for each of the indicators.
- The bars depict the combination of the values for the country pairs.
- You can hover over the bars to see the breakdown of the values based on the individual countries within the country pairs.
- You can click the symbol with the three dots (...) on the upper-right portion of the graphs, if you want to download them.
About the Indicators
- About the Risk-related Indicators
- Port Risk (million USD) (Verschuur et al., 2023): Data includes the estimated amount of freight going through port on a yearly basis in value terms; the annual port-specific risk as the sum of physical damages to port infrastructure, physical damages to critical infrastructure surrounding the port (electricity, road, rail, power plants) within 1 km radius, and the additional logistics losses to port operators, carriers and shippers as a result of downtime; and the amount of trade that is expected to be disrupted by natural hazards and maritime extremes on an annual basis
- Rail & Road (km) exposed (Liu et al., 2023): Length of roads and rail infrastructure and its proportion to total lengths exposed to heavier precipitation in different climate scenarios: RCP 8.5 (mid century)
- Airport disruption per year due to sea level rise (Yesudian & Dawson, 2021) : Risk, defined in terms of expected annual number of route disruptions for all 1,253 airports in the Low Elevation Coastal Zone. Risk is reported (i) Present (current sea level); (ii) 1.5oC (median sea level rise value); (iii) 2oC (median sea level rise value); (iv) RCP8.5 (median sea level rise value); and, (v) RCP8.5+ (95th percentile sea level rise value). A risk score of zero implies that the airport is either not at risk of flooding or has no scheduled routes
- Multi-hazard average annual loss for transport infrastructure (CDRI, 2023)- A measure of annualized future losses over the long term, derived from probabilistic risk models. The average annual loss provides an estimator of losses that are likely to occur every year due to various hazards. The existing climate scenario is considered as the future modeled scenario here. Flooding includes flooding, tropical cyclones, and tsunami; Roads include roads, bridges, and tunnels; Rail includes railway tracks and tunnels
- Trade-Related
- For the detailed data, please download through https://unctadstat.unctad.org/datacentre/. You may find the exact definitions of the trade-related indicators in the said site.
Sources:
UNCTAD & World Bank. (n.d.). TransportCosts. UN Trade & Development Data Hub - Trade-and-Transport Dataset, Annual, 2016 Onward. Retrieved May 1, 2025, from https://unctadstat.unctad.org/datacentre/dataviewer/US.TransportCosts
Verschuur, J., Koks, E. E., Li, S., & Hall, J. W. (2023). Multi-hazard risk to global port infrastructure and resulting trade and logistics losses. Communications Earth & Environment, 4(1), 1-12. https://doi.org/10.1038/s43247-022-00656-7
Liu, K., Wang, Q., Wang, M., & Koks, E. E. (2023). Global transportation infrastructure exposure to the change of precipitation in a warmer world. Nature Communications, 14(1), 2541. https://doi.org/10.1038/s41467-023-38203-3
Yesudian, A. N., & Dawson, R. J. (2021). Global analysis of sea level rise risk to airports. Climate Risk Management, 31, 100266. https://doi.org/10.1016/j.crm.2020.100266
CDRI. (2023). Building & infrastructure | GIRI. https://giri.unepgrid.ch/facts-figures/building-infrastructures
Notes:
- About the Indicators:
- Port Risk (million USD) (Verschuur et al., 2023): Data includes the estimated amount of freight going through port on a yearly basis in value terms; the annual port-specific risk as the sum of physical damages to port infrastructure, physical damages to critical infrastructure surrounding the port (electricity, road, rail, power plants) within 1 km radius, and the additional logistics losses to port operators, carriers and shippers as a result of downtime; and the amount of trade that is expected to be disrupted by natural hazards and maritime extremes on an annual basis
- Rail & Road (km) exposed (Liu et al., 2023): Length of roads and rail infrastructure and its proportion to total lengths exposed to heavier precipitation in different climate scenarios: RCP 8.5 (mid century)
- Airport disruption per year due to sea level rise (Yesudian & Dawson, 2021) : Risk, defined in terms of expected annual number of route disruptions for all 1,253 airports in the Low Elevation Coastal Zone. Risk is reported (i) Present (current sea level); (ii) 1.5oC (median sea level rise value); (iii) 2oC (median sea level rise value); (iv) RCP8.5 (median sea level rise value); and, (v) RCP8.5+ (95th percentile sea level rise value). A risk score of zero implies that the airport is either not at risk of flooding or has no scheduled routes
- Multi-hazard average annual loss for transport infrastructure (CDRI, 2023)- A measure of annualized future losses over the long term, derived from probabilistic risk models. The average annual loss provides an estimator of losses that are likely to occur every year due to various hazards. The existing climate scenario is considered as the future modeled scenario here. Flooding includes flooding, tropical cyclones, and tsunami; Roads include roads, bridges, and tunnels; Rail includes railway tracks and tunnels
- Other
- Please note that the values shown for the risk indicators only include those for the country pairs.
- The trade data also contains those that are tagged as “experimental” by UNCTAD and World Bank. For the detailed data, please download through this link. You may find the exact definitions of the trade-related indicators in the said site.
Sources:
UNCTAD & World Bank. (n.d.). TransportCosts. UN Trade & Development Data Hub - Trade-and-Transport Dataset, Annual, 2016 Onward. Retrieved May 1, 2025, from https://unctadstat.unctad.org/datacentre/dataviewer/US.TransportCosts
Verschuur, J., Koks, E. E., Li, S., & Hall, J. W. (2023). Multi-hazard risk to global port infrastructure and resulting trade and logistics losses. Communications Earth & Environment, 4(1), 1-12. https://doi.org/10.1038/s43247-022-00656-7
Liu, K., Wang, Q., Wang, M., & Koks, E. E. (2023). Global transportation infrastructure exposure to the change of precipitation in a warmer world. Nature Communications, 14(1), 2541. https://doi.org/10.1038/s41467-023-38203-3
Yesudian, A. N., & Dawson, R. J. (2021). Global analysis of sea level rise risk to airports. Climate Risk Management, 31, 100266. https://doi.org/10.1016/j.crm.2020.100266
CDRI. (2023). Building & infrastructure | GIRI. https://giri.unepgrid.ch/facts-figures/building-infrastructures