As the world coordinates global climate action at COP 29, the urgency to better understand histories and trajectories of greenhouse gas (GHG) emissions has never been greater. The latest report from the JRC/IEA paints a stark picture: global GHG emissions reached an unprecedented 53.0 Gt CO2eq in 2023, marking the highest level ever recorded. Among these, the transport sector is pivotal—particularly in the Asia-Pacific region, which accounts for 40% of the total domestic transport emissions. Since the Paris Agreement, the region’s annual emissions growth has been twice the global average, contributing a staggering 83% of the global rise in transport fossil CO2 emissions. The transport sector in Asia increased by 6.6% in 2023 against the previous year. This growth is highest amongst all sectors in all regions. In comparison, global GHG emissions grew by 1.9% in 2023 versus 2022.
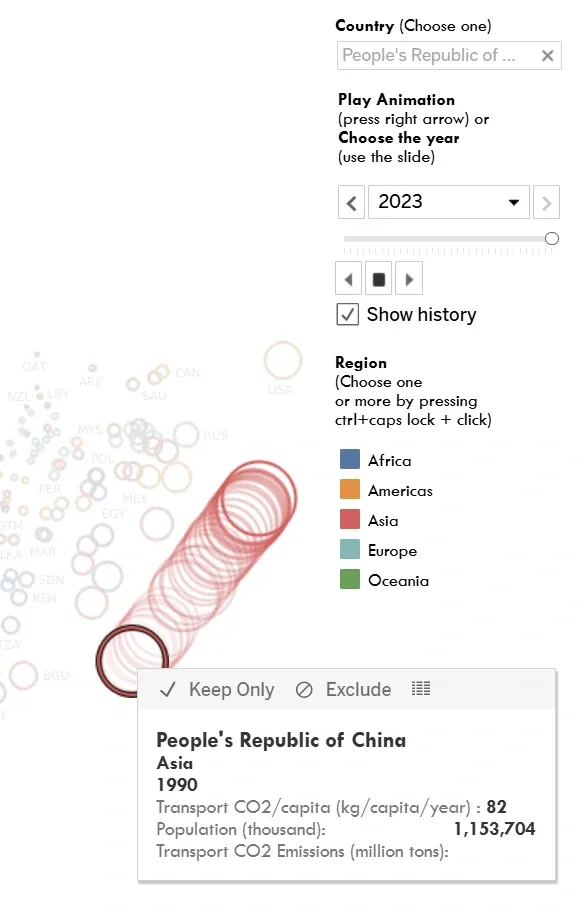
ATO has created a visualization/animation tool using the data from IEA-EDGAR. Country-level transport emissions data from 1990 onwards is represented in the visualization tool which aims at enabling better cognition of the magnitude, direction, and speed of change in transport-sector emissions, not only in Asia but also in the entire globe.
The y-axis depicts the transport CO2 emissions per capita (CO2/capita/year), the x-axis depicts the total transport CO2 emissions (millions/year), while the size of the bubbles depict the population of the countries.
Data Source
The data is based on IEA-EDGAR CO2 (v3), a component of the EDGAR (Emissions Database for Global Atmospheric Research) Community GHG database version EDGAR_2024_GHG (2024) including or based on data from IEA (2023) Greenhouse Gas Emissions from Energy, www.iea.org/data-and-statistics, as modified by the Joint Research Centre. This dataset is used in the GHG emissions of all world countries publication which was released this year.1
How to Use the Visual:
- You can choose a country using the search bar at the upper right of the visual. You can scroll down or type the name of the country (auto-complete)
- You can play the animation which depicts data from 1991 onwards.
- You can also choose to use the sliders to show year-specific data.
- You can choose one or more regions to highlight the data for the countries belonging to the region/regions. If you want to choose more than one, hold the ctrl and the caps lock keys, and click your preferred regions.
- If you click on a country, the visual will include historical data.

Did you find this useful? Interesting? Send us a line at asiantransportoutlook@gmail.com!
-
https://data.europa.eu/doi/10.2760/4002897 "European Commission, Joint Research Centre, Crippa, M., Guizzardi, D., Pagani, F., Banja, M., Muntean, M., Schaaf, E., Monforti-Ferrario, F., Becker, W.E., Quadrelli, R., Risquez Martin, A., Taghavi-Moharamli, P., Köykkä, J., Grassi, G., Rossi, S., Melo, J., Oom, D., Branco, A., San-Miguel, J., Manca, G., Pisoni, E., Vignati, E. and Pekar, F., GHG emissions of all world countries, Publications Office of the European Union, Luxembourg, 2024, https://data.europa.eu/doi/10.2760/4002897, JRC138862." ↩