
Viet Nam Green Roads Profile 2025
VIET NAM
GREEN ROADS PROFILESupported by:
The ATO green roads profiles present country-level perspectives on how 35 Asia-Pacific economies are addressing the development and management of sustainable eco-friendly roads. Drawing from diverse datasets and policy documents, the profiles highlight practices and measures that contribute to greener transport infrastructure.
Developed by the Asian Transport Observatory (ATO) in partnership with the International Road Federation (IRF), the profiles are designed to complement the Green Roads Toolkit. The toolkit provides a practical reference for integrating good practices across nine dimensions:
- Decarbonization
- Climate resilience
- Water and land management
- Pollution reduction
- Conserving biodiversity
- Responsible sourcing of materials
- Improving quality of life
- Disaster preparedness
- Fostering inclusive growth
This 2025 edition builds on earlier work to provide a comprehensive resource for guiding the planning, development, construction, and management of greener, more sustainable roads.
Background
Indicator - Dimension Matrix

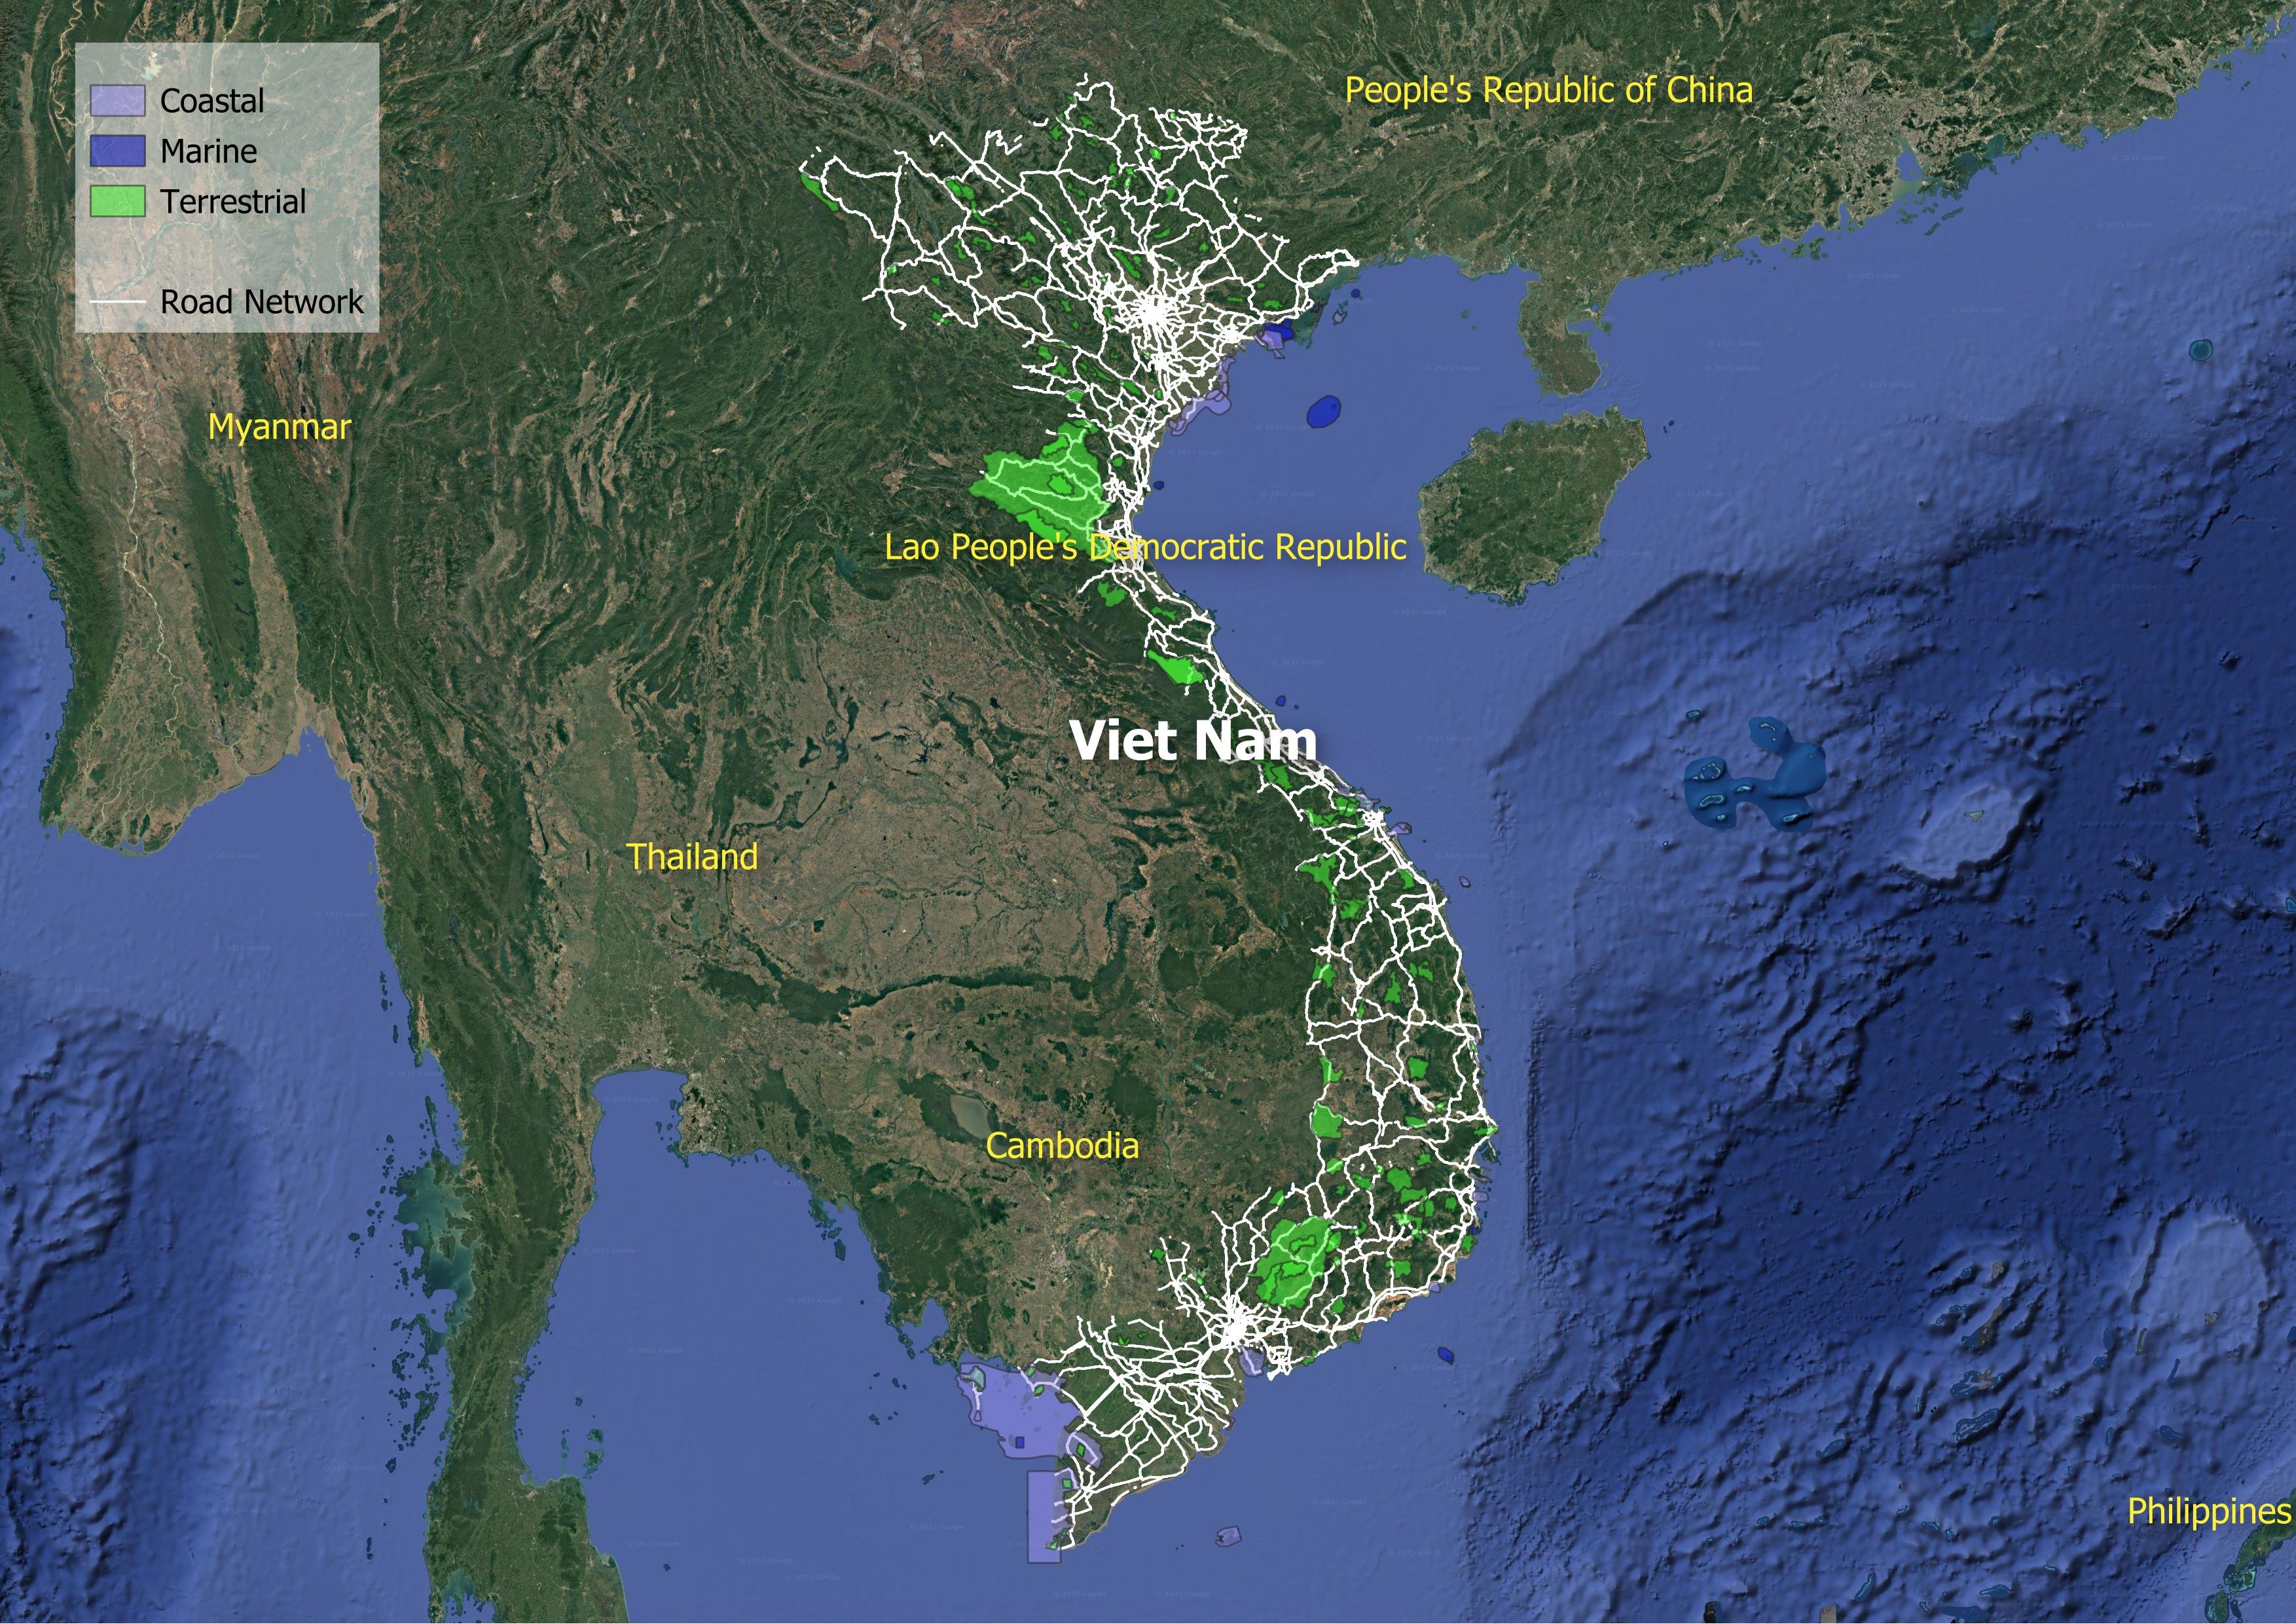
Viet Nam's transport landscape is defined by a distinct, motorcycle-driven pulse that sets it apart from its regional peers. With a population of 101 million spread across roughly 313,000 square kilometers, the nation has woven a dense web of connectivity, primarily through a road network spanning 433,800 kilometers. 92% of infrastructure consists of local and rural roads, while high-capacity motorways and primary roads account for just 2%. As the country navigates the twin imperatives of rapid economic development and climate urgency, the definition of a "green road" in Viet Nam must expand beyond electrification to encompass systemic resilience, material efficiency, and equitable access.
The trajectory of Viet Nam's vehicular growth is steep. Motorization rates have climbed to 752 vehicles per thousand people in 2024, significantly outpacing the Asia-Pacific average of 317. This fleet is almost entirely two-wheelers (95%), with buses and heavy transport constituting negligible fractions. Consequently, road transport greenhouse gas (GHG) emissions reached 44.0 million tonnes of CO2e in 2024, representing 84% of total transport emissions.
A nuanced look at the data reveals a divergence between efficiency and absolute impact. Viet Nam has relatively decoupled emissions intensity from economic growth; the road transport emissions intensity per unit of GDP dropped from 49 grams of CO2e per USD in 1990 to 27 in 2024. This -4.6% annual improvement since 2015 is notable, yet it struggles to offset the sheer volume of demand: absolute road transport emissions have grown by 6.2% annually since 2000, outpacing even economy-wide emission growth.
The decarbonization journey encounters structural challenges. Yet, the E-mobility Readiness Index achieves a solid score of 83 out of 100. In the first half of 2025, Vietnam led among emerging markets with a 35% share of EV sales, boosted by increased sales from VinFast, a local electric vehicle maker, and government incentives for EV adoption. Furthermore, the "greenness" of an EV transition is tethered to the grid; with a grid emission factor of 484 gCO2 per kWh—which has seen zero improvement since 2015—electrification currently merely shifts emissions rather than fully eliminating them.
Beyond the tailpipe, the physical asset base faces dangerous exposure to a volatile climate. Viet Nam incurs estimated average annual losses of 48.6 million USD to transport infrastructure, of which roughly 68% is borne by roads. Bridges and tunnels are disproportionately vulnerable, shouldering nearly 5% of losses despite making up only 0.5% of the infrastructure stock. The future risk profile is severe: under a high-warming scenario (4.5-degree increase), more than 28% of road and rail assets would be exposed to frequent and extreme precipitation.
Construction itself carries a heavy environmental price tag. The material stock in road infrastructure amounts to approximately 2,384.9 million tonnes. Maintaining and expanding this network requires an additional 49.4 million tonnes of material annually, equivalent to 1.9 million tonnes of CO2e. This expansion also encroaches on ecological integrity; research indicates that among Viet Nam's 111 Key Biodiversity Areas (KBAs), 66 contain road infrastructure, equating to a density of 65 meters of road per thousand square kilometers within these sensitive zones.
A truly green transport system must arguably be measured by its impact on human capital. The external costs of the current fossil-fuel-dependent system are staggering. The World Bank estimates the annual cost of health damage from PM2.5 exposure at 52.5 billion USD, or about 7% of GDP. Tailpipe emissions contribute to a burden that results in at least 2,700 premature deaths from PM 2.5 and ozone exposure.
Safety remains a critical crisis. In 2021, road crashes claimed an estimated 17,229 lives. While fatalities have declined by 2% annually between 2016 and 2021, this falls woefully short of the 7.4% annual reduction required to meet 2030 targets. Subsidies exacerbate these issues; fossil fuel subsidies in transport rose to 229 million USD between 2016 and 2023, indirectly incentivizing a system where external costs—crashes, congestion, and road damage—continue to mount.
Road crashes impose a substantial economic burden on Vietnam. In 2021, the combined cost of fatalities and serious injuries reached approximately 19 billion USD, equivalent to 5% of the country's GDP. This figure surpasses the healthcare expenditure of 4.6% of GDP in the same year.In Viet Nam, road crash fatalities decreased by approximately -7.2% per year between 2016 and 2021. However, this is not enough to reach the 2030 target to halve the fatalities by 2030.
Furthermore, the network exhibits stark inequities. Despite high road density, 5.5 million rural residents live more than 2 kilometers from an all-season road, effectively severing them from healthcare, education, and markets. In urban agglomerations, accessibility is similarly fragmented; only 9% of these areas provide public transport access to half their population. The gender gap in the sector is also pronounced, with women comprising only 13.7% of the total transport workforce in 2023.
Viet Nam's road sector stands at a complex intersection. The high rate of two-wheeler adoption offers a unique, potentially agile pathway to electrification. A "Green Road" in Viet Nam cannot simply be a low-carbon thoroughfare; it must be a lifeline that withstands extreme weather, protects biodiversity, and bridges the gap between rural isolation and economic opportunity.
Decarbonization
Climate Resilience
Water and Land Management
Reducing Pollution
Preserving Biodiversity
Sustainable Materials Sourcing and Construction Practices
Improving Quality of life
Disaster Preparedness
Fostering Inclusive Growth
Supporting Information
Road Infrastructure Pipeline
| Basic Infrastructure for Inclusive Growth in the North Central Provinces Sector Project | 2017 | 203.52 million USD | None |
| Climate Resilient Inclusive Infrastructure for Ethnic Minorities Project I | 2021 | 81.73 million USD | None |
| Lach Huyen Port Infrastructure Construction Project (Road and Bridge) (III) | 2016 | None | None |
| North-South Expressway Construction Project (Da Nang - Quang Ngai Section) (III) | 2016 | None | None |
| Northern Mountain Provinces Transport Connectivity Project | 2018 | 240.59 million USD | 198 |
Unit Cost Road Projects
Road Transport Policy Landscape
Road Transport Policy Targets
| National Logistics Master Plan - VNM | 2030 | Contribution of the logistics industry to GDP = 10 (Baseline = 5; 2020) Logistics Industry Growth Rate = 20-25 (Baseline = 15-20; 2020) Logistics Outsourcing Rate = 65 (Baseline = 40; 2020) |
| National Logistics Master Plan - VNM | 2030 | Logistics cost equal to of GDP = 13 (Baseline = 18; 2020) |
| Approving the National Strategy for ensuring road traffic order and safety for the period 2021-2030 and a vision to 2045 | 2030 | 100% of school gate area is located on national highways, provincial roads and urban main roads is ensured with traffic safety and traffic jam prevention. |
| Approving the National Strategy for ensuring road traffic order and safety for the period 2021-2030 and a vision to 2045 | 2030 | 100% of car owners use the electronic toll collection account for multi-purpose payment for road traffic services and pay fines for violations |
| Road network planning for 2021-2030, vision to 2050 | 2030 | The expressway network is planned to be 41 routes, with a total length of about 9,014 km The national highway network consists of 172 routes, with a total length of about 29,795 km |
| Road network planning for 2021-2030, vision to 2050 | 2030 | 100% of district and commune roads will be of technical grade, meeting the transport demand in rural areas |
| Approving the National Strategy for ensuring road traffic order and safety for the period 2021-2030 and a vision to 2045 | 2030 | 100% of newly built national highways and provincial roads (grade III or higher) and 75% of the total length of the national highway network being exploited reach the traffic safety level of 3 stars or more according to the standards of the Global road traffic safety assessment program. |
| Approving the National Strategy for ensuring road traffic order and safety for the period 2021-2030 and a vision to 2045 | 2030 | ensuring 100% of roads that are newly built, upgraded, renovated and being exploited are inspected and assessed in accordance with road safety regulations Newly built, upgraded and renovated roads are considered to include dedicated lanes for motorcycles, motorbikes, bicycles and ensure safety for vulnerable traffic participants. 100% of the provincial road system, 50 - 80% of the district road system is built and fully installed with works and equipment to ensure traffic safety build roadside stations to serve the essential needs of drivers, passengers and vehicles along highways, national highways and provincial highways, ensuring drivers do not have to drive over 04 hours to have a break as regulated. a) Review, adjust and supplement technical standards and regulations on roads and traffic infrastructure works in the direction of approaching and applying modern technologies in traffic organization; develop and issue friendly road design technical manuals. |
| Approving the National Strategy for ensuring road traffic order and safety for the period 2021-2030 and a vision to 2045 | 2030 | 100% of expressways and national highways are equipped with a system of emergency stations, or in the service area of a medical facility capable of giving emergency assistance to a traffic accident victim, ensuring accessibility for traffic accident victims in the fastest time since receiving the emergency request information. All provinces and centrally run cities have emergency medical centers 115, ensuring the fastest access to traffic accident victims since the emergency request information is received. All general hospitals at district or higher level nationwide ensure emergency capacity and access to traffic accident victims in the fastest time since receiving information requesting emergency support. Study to establish new emergency medical stations or improve the capacity of existing medical facilities, ensure the ability to provide emergency traffic accident services as regulated, provide 24/7 on-standby service in general district hospitals, at roadside stations on expressways or at locations with an average service radius of about 50 km, and at the same time build a modern communication network, ensuring accessibility to victims within 30 minutes of receiving emergency request information Promote the application of science and technology in the construction of the 115 medical emergency system nationwide |
| Approving the National Strategy for ensuring road traffic order and safety for the period 2021-2030 and a vision to 2045 | 2030 | 100% of highways, arterial national highways and routes has smart traffic management and operation systems (capable of detecting violations, non-stop electronic toll fee collection, flexible electronic road signs); putting in place smart urban traffic management and operation centers in centrally-run cities and localities in need |
Road Transport Policy Measure Types
References
AIIB. (n.d.). MEASURING TRANSPORT CONNECTIVITY FOR TRADE IN ASIA. https://impact.economist.com/perspectives/sites/default/files/eco141_aiib_transport_connectivity_4.pdf/
Asian Transport Observatory. (2025). Asia and the Pacific's Transport Infrastructure and Investment Outlook 2035. https://asiantransportobservatory.org/analytical-outputs/asia-transport-infrastructure-investment-needs/
Barrington-Leigh, C., & Millard-Ball, A. (2025). A high-resolution global time series of street-network sprawl. https://journals.sagepub.com/doi/10.1177/23998083241306829
CDRI. (2023). Global Infrastructure Risk Model and Resilience Index. https://giri.unepgrid.ch/
CIESIN. (2023a). Rural Access Index [Dataset]. https://sedac.ciesin.columbia.edu/data/set/sdgi-9-1-1-rai-2023
CIESIN. (2023b). SDG Indicator 11.2.1: Urban Access to Public Transport, 2023 Release: Sustainable Development Goal Indicators (SDGI). https://sedac.ciesin.columbia.edu/data/set/sdgi-11-2-1-urban-access-public-transport-2023
EDGAR. (2025). GHG emissions of all world countries: 2025. Publications Office. https://data.europa.eu/doi/10.2760/9816914
Ember. (2024). Electricity Data Explorer [Dataset]. https://ember-energy.org/data/electricity-data-explorer
EM-DAT. (2025). EM-DAT - The international disaster database. https://www.emdat.be/European Commission. (2024). Global Air Pollutant Emissions EDGAR v8.1 [Dataset]. https://edgar.jrc.ec.europa.eu/dataset_ap61#sources
IEA. (n.d.). Fossil Fuel Subsidies. IEA. Retrieved April 19, 2025, from https://www.iea.org/topics/fossil-fuel-subsidies
ILO. (2025). ILOSTAT [Dataset]. https://rplumber.ilo.org/files/website/bulk/indicator.html
ITDP. (2024). The Atlas of Sustainable City Transport. https://atlas.itdp.org/
Koks, E., Rozenberg, J., Tariverdi, M., Dickens, B., Fox, C., Ginkel, K. van, & Hallegatte, S. (2023). A global assessment of national road network vulnerability. Environmental Research: Infrastructure and Sustainability, 3(2), 025008. https://doi.org/10.1088/2634-4505/acd1aa
Liu, K., Wang, Q., Wang, M., & Koks, E. E. (2023). Global transportation infrastructure exposure to the change of precipitation in a warmer world. Nature Communications, 14(1), 2541. https://doi.org/10.1038/s41467-023-38203-3
McDuffie, E. E., Martin, R. V., Spadaro, J. V., Burnett, R., Smith, S. J., O'Rourke, P., Hammer, M. S., van Donkelaar, A., Bindle, L., Shah, V., Jaeglé, L., Luo, G., Yu, F., Adeniran, J. A., Lin, J., & Brauer, M. (2021). Source sector and fuel contributions to ambient PM2.5 and attributable mortality across multiple spatial scales. Nature Communications, 12(1), 3594. https://doi.org/10.1038/s41467-021-23853-y
Parry, S. B., Antung A. Liu,Ian W. H. (2023). IMF Fossil Fuel Subsidies Data: 2023 Update. IMF. https://www.imf.org/en/publications/wp/issues/2023/08/22/imf-fossil-fuel-subsidies-data-2023-update-537281
Simkins, A. T., Beresford, A. E., Buchanan, G. M., Crowe, O., Elliott, W., Izquierdo, P., Patterson, D. J., & Butchart, S. H. M. (2023). A global assessment of the prevalence of current and potential future infrastructure in Key Biodiversity Areas. Biological Conservation, 281, 109953. https://doi.org/10.1016/j.biocon.2023.109953
Sims, M., Stanimirova, R., Neumann, M., Raichuk, A., & Purves, D. (2025). New Data Shows What's Driving Forest Loss Around the World. https://www.wri.org/insights/forest-loss-drivers-data-trends
Trademap. (2025). Trade Map. Trade Map. https://www.trademap.org/Index.aspx
UN DESA. (n.d.). Economic and Environmental Vulnerability Indicators. Retrieved January 26, 2026, from https://policy.desa.un.org/themes/least-developed-countries-category/ldc-identification-criteria-indicators/evi-indicators
UN DESA. (2025). 2024 Revision of World Population Prospects. https://population.un.org/wpp/
UN Energy Statistics. (2025). Energy Balance Visualization [Dataset]. https://unstats.un.org/unsd/energystats/dataPortal/
UNEP. (2021, May 12). Domestic material consumption (DMC) and DMC per capita, per GDP (Tier I). https://www.unep.org/indicator-1222
Weiss, D. J., Nelson, A., Gibson, H. S., Temperley, W., Peedell, S., Lieber, A., Hancher, M., Poyart, E., Belchior, S., Fullman, N., Mappin, B., Dalrymple, U., Rozier, J., Lucas, T. C. D., Howes, R. E., Tusting, L. S., Kang, S. Y., Cameron, E., Bisanzio, D., … Gething, P. W. (2018). A global map of travel time to cities to assess inequalities in accessibility in 2015. Nature, 553(7688), 333-336. https://doi.org/10.1038/nature25181
WHO. (2023). Global Status Report on Road Safety 2023. https://www.who.int/teams/social-determinants-of-health/safety-and-mobility/global-status-report-on-road-safety-2023
Wiedenhofer, D., Baumgart, A., Matej, S., Virág, D., Kalt, G., Lanau, M., Tingley, D. D., Liu, Z., Guo, J., Tanikawa, H., & Haberl, H. (2024). Mapping and modelling global mobility infrastructure stocks, material flows and their embodied greenhouse gas emissions [Dataset]. https://doi.org/10.1016/j.jclepro.2023.139742
World Bank. (2021). ICP 2021. https://databank.worldbank.org/source/icp-2021
World Bank. (2022a). Annual freshwater withdrawals, total (% of internal resources) [Dataset]. https://data.worldbank.org
World Bank. (2022b). Land area (sq. Km) [Dataset]. https://data.worldbank.org
World Bank. (2022c). The Global Health Cost of PM2.5 Air Pollution: A Case for Action Beyond 2021. The World Bank. https://doi.org/10.1596/978-1-4648-1816-5
World Bank. (2023). Forest area (% of land area) [Dataset]. https://data.worldbank.org/indicator/AG.LND.FRST.ZS
World Bank. (2024). Home | Logistics Performance Index (LPI). Logistics Performance Index. https://lpi.worldbank.org/
World Bank. (2025a). GDP per capita, PPP (current international $) [Dataset]. https://data.worldbank.org/indicator/NY.GDP.PCAP.PP.CD
World Bank. (2025b). GDP, PPP (current international $) [Dataset]. https://data.worldbank.org/indicator/NY.GDP.MKTP.PP.CD
World Database on Protected Areas. (2024). Protected Areas (WDPA) [Dataset]. https://www.protectedplanet.net/en/thematic-areas/wdpa?tab=WDPA