
Uzbekistan Green Roads Profile 2025
UZBEKISTAN
GREEN ROADS PROFILESupported by:
The ATO green roads profiles present country-level perspectives on how 35 Asia-Pacific economies are addressing the development and management of sustainable eco-friendly roads. Drawing from diverse datasets and policy documents, the profiles highlight practices and measures that contribute to greener transport infrastructure.
Developed by the Asian Transport Observatory (ATO) in partnership with the International Road Federation (IRF), the profiles are designed to complement the Green Roads Toolkit. The toolkit provides a practical reference for integrating good practices across nine dimensions:
- Decarbonization
- Climate resilience
- Water and land management
- Pollution reduction
- Conserving biodiversity
- Responsible sourcing of materials
- Improving quality of life
- Disaster preparedness
- Fostering inclusive growth
This 2025 edition builds on earlier work to provide a comprehensive resource for guiding the planning, development, construction, and management of greener, more sustainable roads.
Background
Indicator - Dimension Matrix

Uzbekistan's distinct geography requires a transport network that is as robust as it is extensive. Spanning roughly 441,000 square kilometers, the nation relies on a road network of 179,900 kilometers to bind its economy together. While only 3% of this infrastructure consists of motorways or primary roads, the vast majority—92%—is comprised of local and rural roads, serving as the critical capillaries for the country's 36.4 million people. As the country modernizes, the challenge lies in decoupling economic growth from environmental degradation while ensuring that the infrastructure stock remains resilient to a shifting climate.
The carbon footprint of mobility presents a complex picture of rising absolute emissions tempered by significant efficiency gains. By 2024, road transport generated 18.3 million tonnes of CO2 equivalent (CO2e), accounting for 98% of the transport sector's total emissions and 8% of economy-wide emissions. Since 2000, these emissions have grown by 3.1% annually, outpacing the 1.2% growth rate of economy-wide emissions. This trajectory is driven by a rapid increase in motorization, which climbed from 186 vehicles per thousand population in 2000 to 209 in 2024.
Yet, the efficiency of the Uzbek economy regarding transport emissions has improved markedly. The emissions intensity—measured against GDP—plummeted from 139 grams of CO2e per USD in 1990 to just 42 grams in 2024. Since 2015, this intensity has improved by 4.7% per year, a rate that outperforms the Asia-Pacific average reduction of 5.4%. Despite this progress, Uzbekistan's intensity remains higher than the Asia-Pacific average of 26 grams per USD, suggesting that structural inefficiencies persist alongside rapid economic growth.
A quiet revolution is underway in the composition of the vehicle fleet. Between 2015 and 2024, the value of electric vehicle (EV) imports reached 2.0 billion USD, and by 2024, EVs represented a significant 28% of total road vehicle imports. This shift is currently skewed toward light-duty vehicles (LDVs), which make up 91% of EV imports, while goods vehicles and buses comprise just 5%.
However, this transition faces friction from fiscal policy. Fossil fuel subsidies in the transport sector rose from roughly 1.9 billion USD between 2010 and 2015 to 3.1 billion USD in the 2016-2023 period. These subsidies do more than distort market prices; they incur heavy external costs. The societal price tag of petroleum use manifests primarily in road crashes (73% of external costs), followed by congestion (21%) and road damage (6%). UNEP's E-mobility Readiness Index scores Uzbekistan at 79 out of 100, indicating strong potential, though policy and energy alignment lag slightly behind financial readiness.
Building green roads is not solely about mitigation; it is about survival. Uzbekistan faces estimated average annual losses of 8.4 million USD to transport infrastructure, with nearly 70% of this damage sustained by roads. Bridges and tunnels are disproportionately vulnerable, bearing 5.2% of losses despite constituting only 0.2% of the infrastructure.
Climate projections escalate these risks. Under a 4.5-degree increase scenario, more than 19% of the country's road and rail assets would be exposed to more frequent and extreme precipitation. This physical vulnerability is compounded by material inefficiencies. The maintenance and expansion of the network consume an estimated 15.8 million tonnes of material annually, generating nearly 794,000 tonnes of embodied CO2 emissions.
The current transport paradigm exacts a high toll on public health and biodiversity. In 2022, the transport sector contributed about 2,200 tonnes of harmful PM 2.5 emissions, 87% of which originated from road transport. The World Bank estimates the annual cost of health damages from PM 2.5 exposure at 17.9 billion USD, or roughly 7% of GDP. Beyond air quality, the physical safety of the network remains a concern. In 2021, road crashes resulted in 3,155 fatalities. While fatalities decreased by 2% annually between 2016 and 2021, this falls well short of the 7.4% reduction required to halve deaths by 2030.
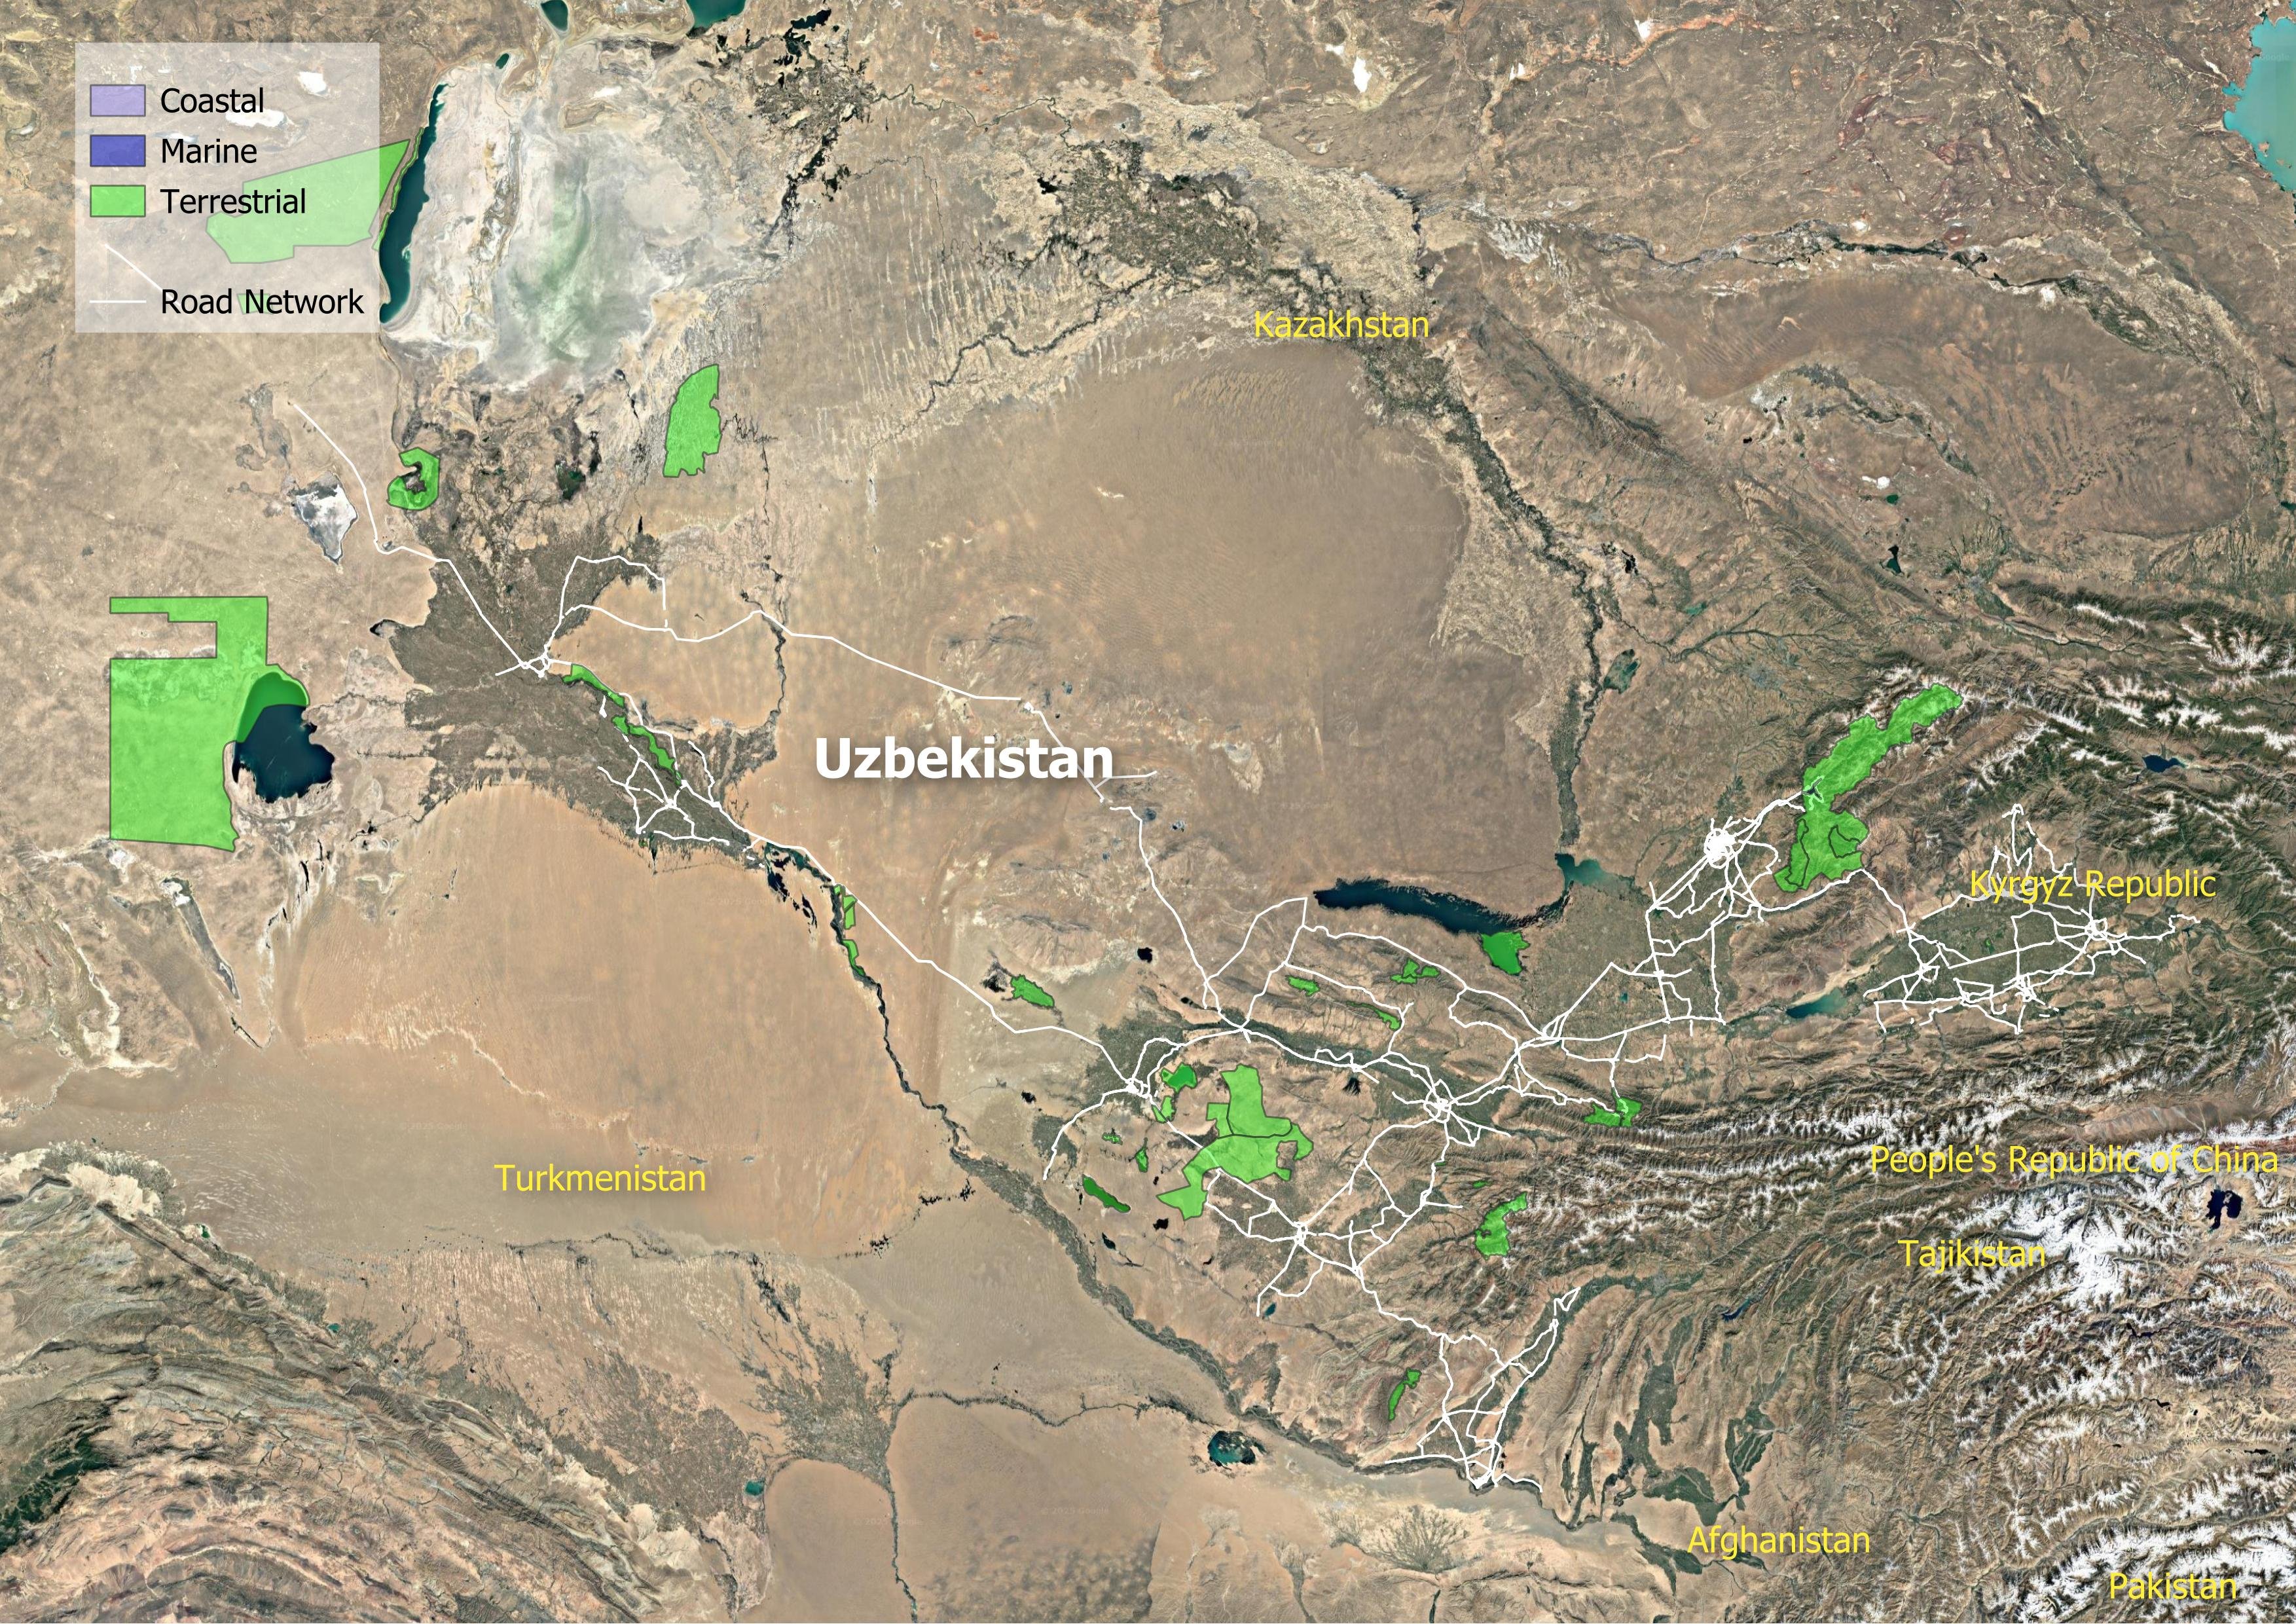
Furthermore, infrastructure expansion often conflicts with ecological preservation. Research indicates that road infrastructure penetrates 28 of Uzbekistan's 54 key biodiversity areas. A review of 21 road projects suggests they could endanger over 930,000 tonnes of carbon stocks and disrupt nitrogen retention.
Ultimately, the measure of a road network is its utility to the population. A stark divide exists in accessibility: 6.3 million rural residents live beyond the reach of all-season roads, cutting them off from essential services and markets. In urban areas, only 4% of agglomerations provide public transport access to half their population (for cities with data), and merely 38% of urban dwellers have access to healthcare and education within a reasonable 1-kilometer distance.
Achieving a sustainable transport future for Uzbekistan requires a synchronized approach that removes distortive subsidies, hardens infrastructure against climate shocks, and prioritizes the accessibility needs of the rural population. The data suggests that while the technological transition to electric mobility is accelerating, the structural transition toward a safe, resilient, and inclusive network demands more aggressive policy intervention.
Decarbonization
Climate Resilience
Water and Land Management
Reducing Pollution
Preserving Biodiversity
Sustainable Materials Sourcing and Construction Practices
Improving Quality of life
Disaster Preparedness
Fostering Inclusive Growth
Supporting Information
Road Infrastructure Pipeline
| Central Asia Regional Economic Cooperation Corridor 2 Karakalpakstan Road (A380 Kungrad to Daut-Ata Section) Project | 2020 | 383.4 million USD | 240 |
| Central Asia Regional Economic Cooperation Road Corridor 2 Resilience and Modernization Project | 2025 | None | 87 |
| Road Subsector Development Strategy and Action Plan | 2020 | 3.4 million USD | None |
| Rural Roads Resilience Sector Project | 2023 | 298.75 million USD | None |
| Tashkent–Andijan Toll Highway (via Kamchik Pass) | None | 4280 million USD | 314 |
| Tashkent–Samarkand–Bukhara Toll Highway | None | 3200 million USD | 733 |
| Uzbekistan: Bukhara Road Network Improvement Project (Phase 1) | 2020 | None | None |
| Uzbekistan: Karakalpakstan and Khorezm Local Roads Network Reconstruction Project | - | None | 647 |
Road User Charging
| Actual maintenance budget | 125 |
| Required maintenance budget | 431 |
| Maintenance budget deficit | 306 |
| Fuel excise tax | 160 |
| Fuel excise tax for end consumers | 328 |
| Vehicle value added tax | 754 |
| Vehicle customs duty | 312 |
| Foreign vehicle entry fee | 20 |
| Heavy vehicle fee | 32 |
Unit Cost Road Projects
Road Transport Policy Landscape
Road Transport Policy Targets
| Draft Strategy for the Development of the Transport System of the Republic of Uzbekistan until 2035 | 2035 | develop a program of measures for the introduction of transport interchange systems, primarily through the introduction of a model of transport interchange nodes in large, large and major cities of the country (14 units by 2035); |
| Draft Strategy for the Development of the Transport System of the Republic of Uzbekistan until 2035 | 2035 | Reducing the level of specific transportation costs in the price of products by 2035 according to the basic option - from 15 percent in 2018 to 10% in 2035, according to the innovative option - up to 7 percent. |
Road Transport Policy Measure Types
References
AIIB. (n.d.). MEASURING TRANSPORT CONNECTIVITY FOR TRADE IN ASIA. https://impact.economist.com/perspectives/sites/default/files/eco141_aiib_transport_connectivity_4.pdf/
Asian Transport Observatory. (2025). Asia and the Pacific's Transport Infrastructure and Investment Outlook 2035. https://asiantransportobservatory.org/analytical-outputs/asia-transport-infrastructure-investment-needs/
Barrington-Leigh, C., & Millard-Ball, A. (2025). A high-resolution global time series of street-network sprawl. https://journals.sagepub.com/doi/10.1177/23998083241306829
CDRI. (2023). Global Infrastructure Risk Model and Resilience Index. https://giri.unepgrid.ch/
CIESIN. (2023a). Rural Access Index [Dataset]. https://sedac.ciesin.columbia.edu/data/set/sdgi-9-1-1-rai-2023
CIESIN. (2023b). SDG Indicator 11.2.1: Urban Access to Public Transport, 2023 Release: Sustainable Development Goal Indicators (SDGI). https://sedac.ciesin.columbia.edu/data/set/sdgi-11-2-1-urban-access-public-transport-2023
EDGAR. (2025). GHG emissions of all world countries: 2025. Publications Office. https://data.europa.eu/doi/10.2760/9816914
Ember. (2024). Electricity Data Explorer [Dataset]. https://ember-energy.org/data/electricity-data-explorer
EM-DAT. (2025). EM-DAT - The international disaster database. https://www.emdat.be/European Commission. (2024). Global Air Pollutant Emissions EDGAR v8.1 [Dataset]. https://edgar.jrc.ec.europa.eu/dataset_ap61#sources
IEA. (n.d.). Fossil Fuel Subsidies. IEA. Retrieved April 19, 2025, from https://www.iea.org/topics/fossil-fuel-subsidies
ILO. (2025). ILOSTAT [Dataset]. https://rplumber.ilo.org/files/website/bulk/indicator.html
ITDP. (2024). The Atlas of Sustainable City Transport. https://atlas.itdp.org/
Koks, E., Rozenberg, J., Tariverdi, M., Dickens, B., Fox, C., Ginkel, K. van, & Hallegatte, S. (2023). A global assessment of national road network vulnerability. Environmental Research: Infrastructure and Sustainability, 3(2), 025008. https://doi.org/10.1088/2634-4505/acd1aa
Liu, K., Wang, Q., Wang, M., & Koks, E. E. (2023). Global transportation infrastructure exposure to the change of precipitation in a warmer world. Nature Communications, 14(1), 2541. https://doi.org/10.1038/s41467-023-38203-3
McDuffie, E. E., Martin, R. V., Spadaro, J. V., Burnett, R., Smith, S. J., O'Rourke, P., Hammer, M. S., van Donkelaar, A., Bindle, L., Shah, V., Jaeglé, L., Luo, G., Yu, F., Adeniran, J. A., Lin, J., & Brauer, M. (2021). Source sector and fuel contributions to ambient PM2.5 and attributable mortality across multiple spatial scales. Nature Communications, 12(1), 3594. https://doi.org/10.1038/s41467-021-23853-y
Parry, S. B., Antung A. Liu,Ian W. H. (2023). IMF Fossil Fuel Subsidies Data: 2023 Update. IMF. https://www.imf.org/en/publications/wp/issues/2023/08/22/imf-fossil-fuel-subsidies-data-2023-update-537281
Simkins, A. T., Beresford, A. E., Buchanan, G. M., Crowe, O., Elliott, W., Izquierdo, P., Patterson, D. J., & Butchart, S. H. M. (2023). A global assessment of the prevalence of current and potential future infrastructure in Key Biodiversity Areas. Biological Conservation, 281, 109953. https://doi.org/10.1016/j.biocon.2023.109953
Sims, M., Stanimirova, R., Neumann, M., Raichuk, A., & Purves, D. (2025). New Data Shows What's Driving Forest Loss Around the World. https://www.wri.org/insights/forest-loss-drivers-data-trends
Trademap. (2025). Trade Map. Trade Map. https://www.trademap.org/Index.aspx
UN DESA. (n.d.). Economic and Environmental Vulnerability Indicators. Retrieved January 26, 2026, from https://policy.desa.un.org/themes/least-developed-countries-category/ldc-identification-criteria-indicators/evi-indicators
UN DESA. (2025). 2024 Revision of World Population Prospects. https://population.un.org/wpp/
UN Energy Statistics. (2025). Energy Balance Visualization [Dataset]. https://unstats.un.org/unsd/energystats/dataPortal/
UNEP. (2021, May 12). Domestic material consumption (DMC) and DMC per capita, per GDP (Tier I). https://www.unep.org/indicator-1222
Weiss, D. J., Nelson, A., Gibson, H. S., Temperley, W., Peedell, S., Lieber, A., Hancher, M., Poyart, E., Belchior, S., Fullman, N., Mappin, B., Dalrymple, U., Rozier, J., Lucas, T. C. D., Howes, R. E., Tusting, L. S., Kang, S. Y., Cameron, E., Bisanzio, D., … Gething, P. W. (2018). A global map of travel time to cities to assess inequalities in accessibility in 2015. Nature, 553(7688), 333-336. https://doi.org/10.1038/nature25181
WHO. (2023). Global Status Report on Road Safety 2023. https://www.who.int/teams/social-determinants-of-health/safety-and-mobility/global-status-report-on-road-safety-2023
Wiedenhofer, D., Baumgart, A., Matej, S., Virág, D., Kalt, G., Lanau, M., Tingley, D. D., Liu, Z., Guo, J., Tanikawa, H., & Haberl, H. (2024). Mapping and modelling global mobility infrastructure stocks, material flows and their embodied greenhouse gas emissions [Dataset]. https://doi.org/10.1016/j.jclepro.2023.139742
World Bank. (2021). ICP 2021. https://databank.worldbank.org/source/icp-2021
World Bank. (2022a). Annual freshwater withdrawals, total (% of internal resources) [Dataset]. https://data.worldbank.org
World Bank. (2022b). Land area (sq. Km) [Dataset]. https://data.worldbank.org
World Bank. (2022c). The Global Health Cost of PM2.5 Air Pollution: A Case for Action Beyond 2021. The World Bank. https://doi.org/10.1596/978-1-4648-1816-5
World Bank. (2023). Forest area (% of land area) [Dataset]. https://data.worldbank.org/indicator/AG.LND.FRST.ZS
World Bank. (2024). Home | Logistics Performance Index (LPI). Logistics Performance Index. https://lpi.worldbank.org/
World Bank. (2025a). GDP per capita, PPP (current international $) [Dataset]. https://data.worldbank.org/indicator/NY.GDP.PCAP.PP.CD
World Bank. (2025b). GDP, PPP (current international $) [Dataset]. https://data.worldbank.org/indicator/NY.GDP.MKTP.PP.CD
World Database on Protected Areas. (2024). Protected Areas (WDPA) [Dataset]. https://www.protectedplanet.net/en/thematic-areas/wdpa?tab=WDPA