
Turkmenistan Green Roads Profile 2025
TURKMENISTAN
GREEN ROADS PROFILESupported by:
The ATO green roads profiles present country-level perspectives on how 35 Asia-Pacific economies are addressing the development and management of sustainable eco-friendly roads. Drawing from diverse datasets and policy documents, the profiles highlight practices and measures that contribute to greener transport infrastructure.
Developed by the Asian Transport Observatory (ATO) in partnership with the International Road Federation (IRF), the profiles are designed to complement the Green Roads Toolkit. The toolkit provides a practical reference for integrating good practices across nine dimensions:
- Decarbonization
- Climate resilience
- Water and land management
- Pollution reduction
- Conserving biodiversity
- Responsible sourcing of materials
- Improving quality of life
- Disaster preparedness
- Fostering inclusive growth
This 2025 edition builds on earlier work to provide a comprehensive resource for guiding the planning, development, construction, and management of greener, more sustainable roads.
Background
Indicator - Dimension Matrix

Spanning roughly 470,000 square kilometers, Turkmenistan's vast geography necessitates a robust transport network to connect its 7.5 million citizens. The current 49,300-kilometer road network—comprising 85% local and rural roads—serves as the primary artery for the nation's mobility. Yet, this infrastructure faces a tripartite challenge: it must decarbonize to meet climate goals, harden against intensifying weather extremes, and expand to resolve persistent inequities in rural access. The pathway to a "green road" system in Turkmenistan is not just an environmental aspiration but a fundamental economic and social necessity.
The trajectory of Turkmenistan's vehicle fleet offers a complex baseline for decarbonization. Motorization has risen to 205 vehicles per thousand people, yet remains well below the Asia-Pacific average of 317, suggesting the country is on the cusp of a significant mobility expansion. While road transport constitutes the entirety of the transport sector's greenhouse gas (GHG) output—reaching 6.5 million tonnes of CO2 equivalent in 2024—the efficiency of this growth shows promise. Since 2015, the emissions intensity relative to GDP has improved by 8.5% annually, outperforming regional peers in Central and West Asia. However, this efficiency gain is shadowed by a heavy fiscal burden: between 2016 and 2023, fossil fuel subsidies in transport amounted to USD 9.9 billion. These subsidies mask the true societal costs of transport, where external damages from congestion and road crashes account for 97% of the burden, significantly outweighing costs associated with road damage.
Transitioning this fleet requires overcoming structural inertia. Electric vehicle (EV) adoption is in its infancy, representing just 1% of total vehicle imports and comprised almost entirely of light-duty vehicles. The UNEP rates Turkmenistan's E-mobility readiness at 41 out of 100 in 2024, citing an absence in policy frameworks despite moderate readiness in energy infrastructure. Without targeted policy intervention to pivot the 99% of imports that remain internal combustion engines, the lock-in effect of carbon-intensive assets will persist for decades.
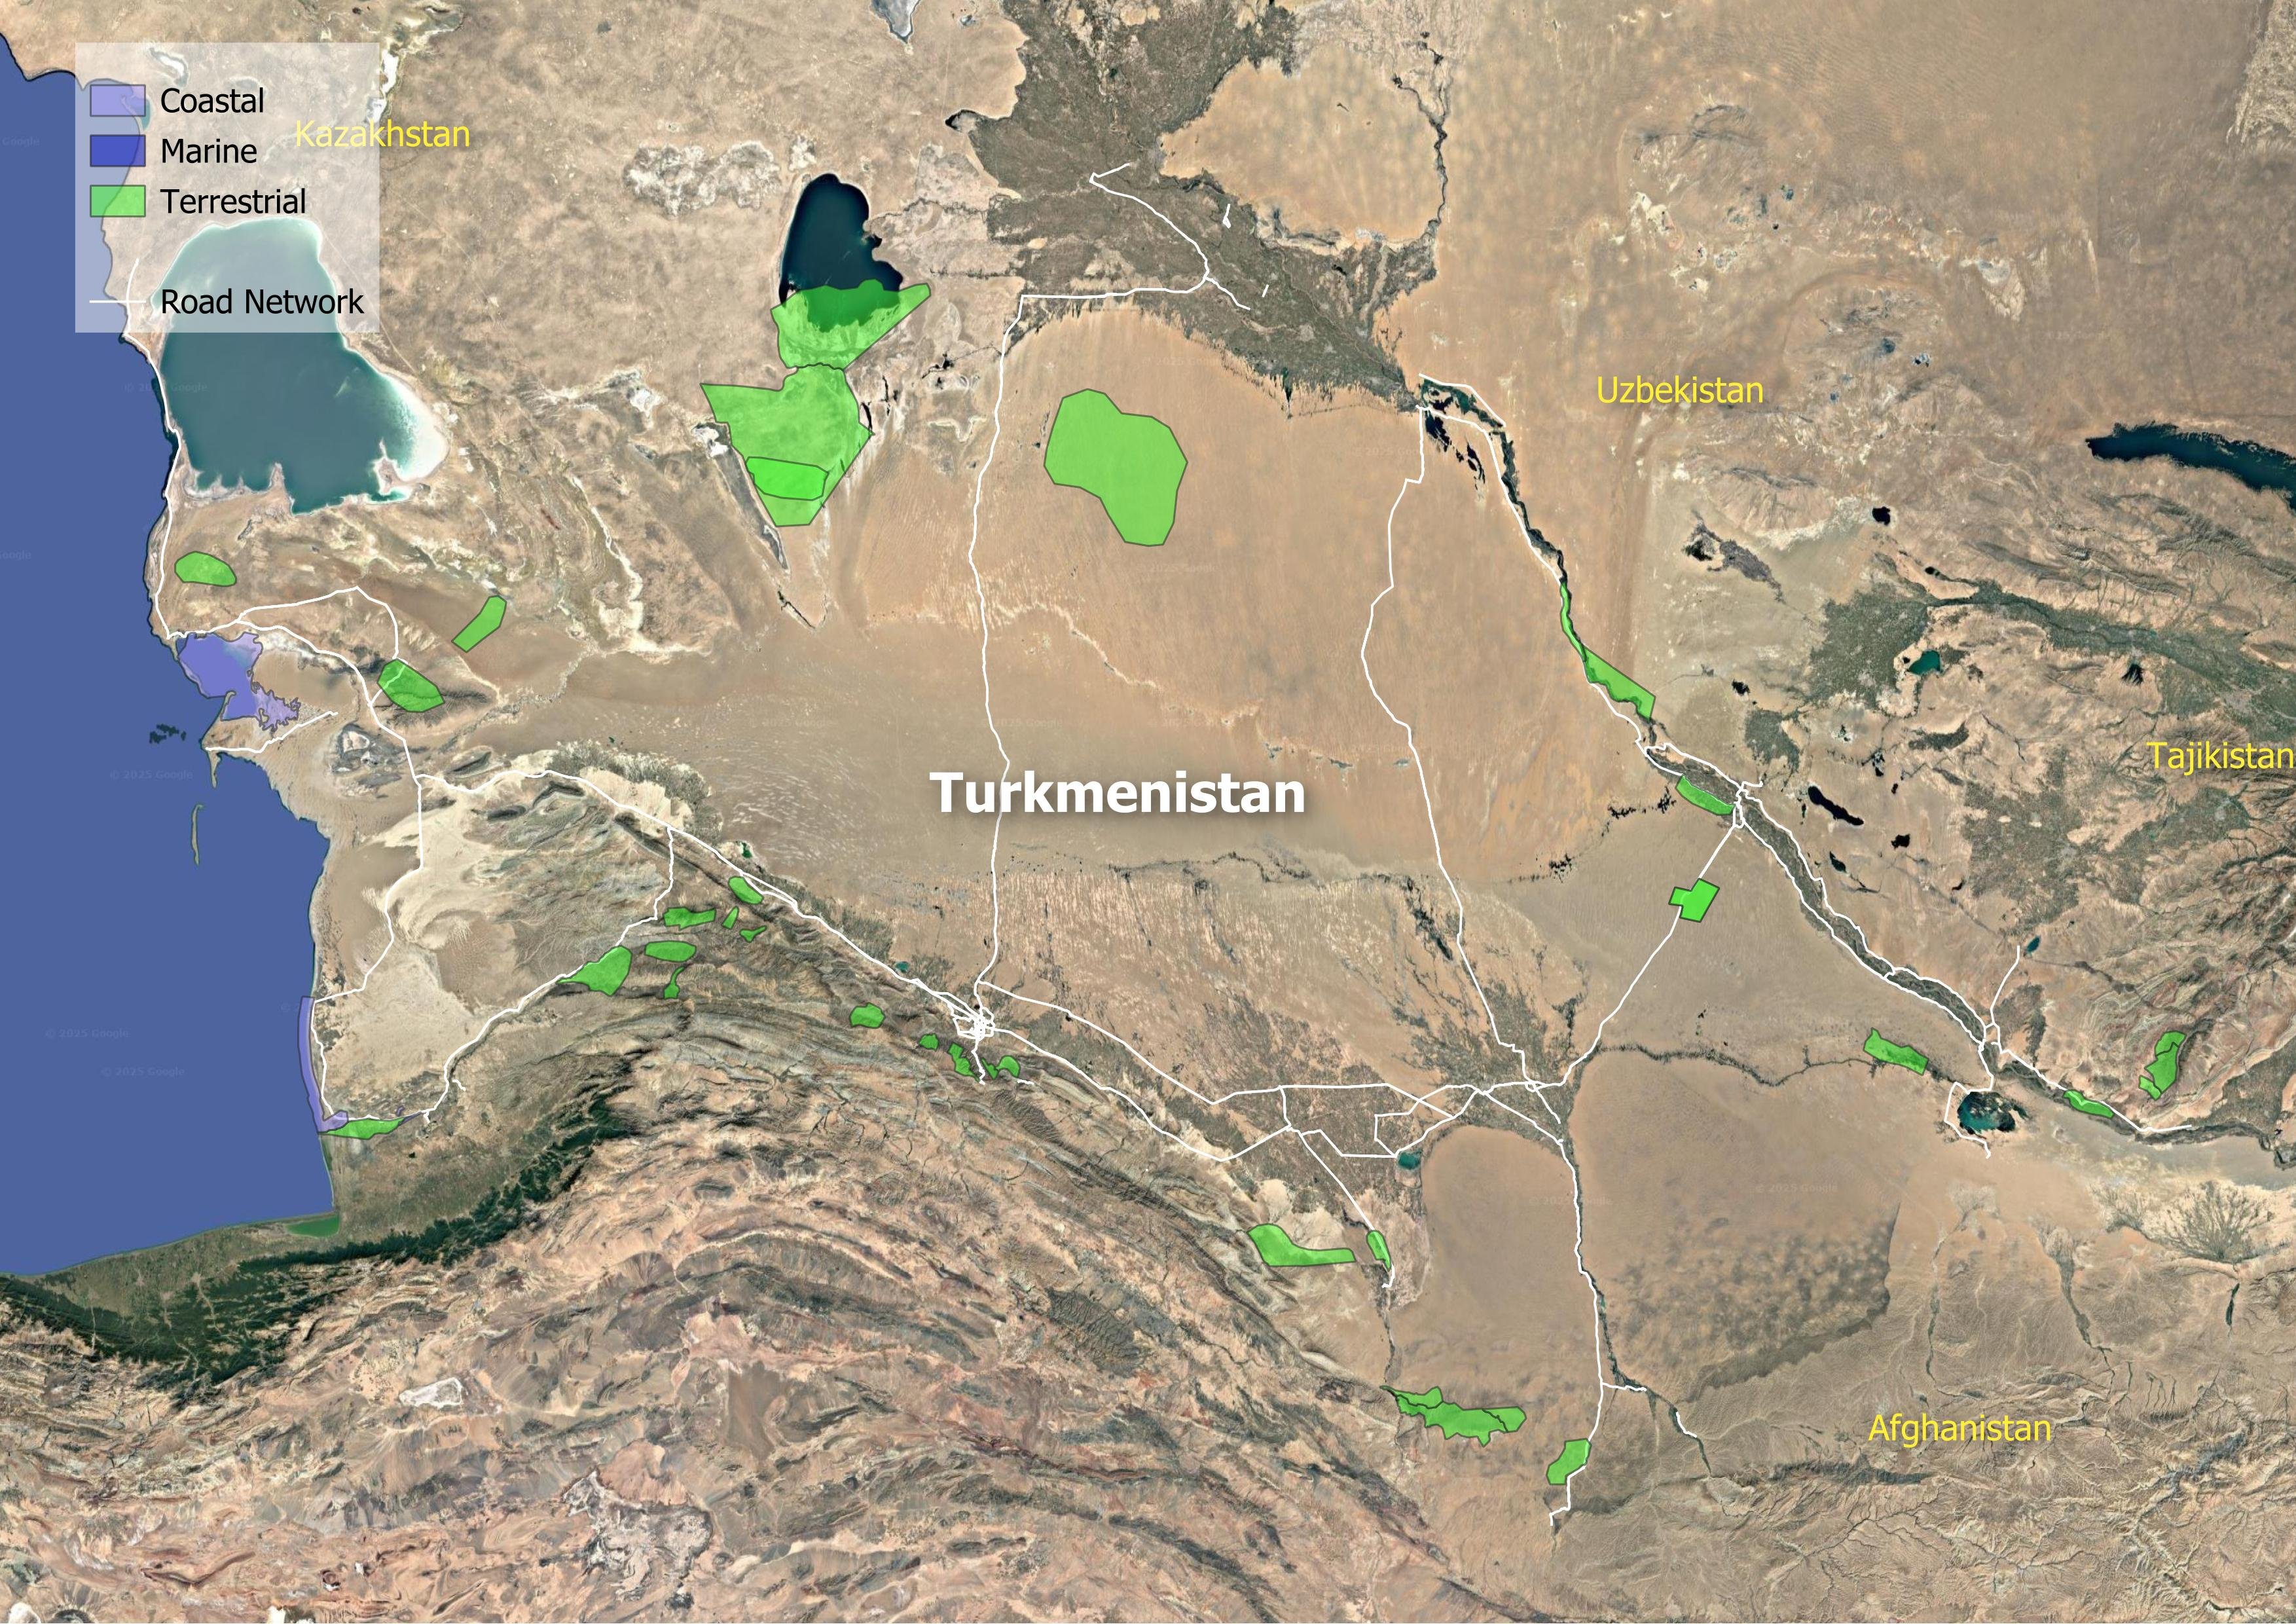
Beyond the tailpipe, the physical road network represents a massive stock of embodied carbon and material capital. Modelling suggests the road infrastructure contains 266.3 million tonnes of material stock, with expansion and maintenance demanding an additional 7.6 million tonnes annually. This material throughput generates roughly 383,000 tonnes of embodied CO2 emissions every year. Furthermore, infrastructure placement increasingly conflicts with ecological preservation. Research indicates that 33 of Turkmenistan's 50 Key Biodiversity Areas currently contain road infrastructure, equating to a density of 25 meters per thousand square kilometers within these sensitive zones. New projects must be scrutinized; UNEP mapping of 13 upcoming road projects warns of potential risks to over 545,000 tonnes of carbon stocks and 677 kg of Nitrogen retention by vegetation, endangering biodiversity, among others.
Climate resilience is no longer a theoretical concern for these assets. Under a 4.5-degree warming scenario, nearly a quarter of the country's road and rail assets face exposure to extreme precipitation. The economic implications are immediate: the country already faces estimated annual losses of USD 14.9 million to transport infrastructure, with roads absorbing 70% of this damage.
Ultimately, the measure of a green road network is its ability to serve people equitably. The current system leaves 1.9 million rural residents—more than a quarter of the population—beyond the reach of all-season roads, severing their reliable access to markets, healthcare, and education. Urban agglomerations face similar connectivity deficits; in 44% of cities with data, only two out of ten residents have access to public transport, and only 11% of urban areas achieve a high accessibility rating. This disconnect forces a reliance on private vehicles, exacerbating air quality issues where road transport already contributes 99% of the sector's PM 2.5 emissions. The World Bank estimates the health damages from ambient PM 2.5 exposure cost the economy USD 5.4 billion annually, or roughly 6% of GDP.
The economic burden of road crashes in Turkmenistan is substantial. Estimated at approximately 2 billion USD in 2021, representing roughly 2% of the country's GDP, these costs encompass fatalities, injuries, and related expenses. Furthermore, road crashes contribute significantly to the implicit costs of fossil fuel subsidies in transport, accounting for about 43% of the total. The International Road Assessment Programme (iRAP) estimates that an annual investment of 206 million USD (approximately 0.3% of GDP) could potentially prevent around 200 fatalities annually. This highlights the potential for cost-effective interventions to improve road safety.
The data underscores that the cost of inaction—measured in health impacts, climate vulnerability, and economic inefficiency—far exceeds the investment required to modernize.
Decarbonization
Climate Resilience
Water and Land Management
Reducing Pollution
Preserving Biodiversity
Sustainable Materials Sourcing and Construction Practices
Improving Quality of life
Disaster Preparedness
Fostering Inclusive Growth
Supporting Information
Road Infrastructure Pipeline
| Ashgabat–Turkmenabat High-Speed Highway | 2019 | 2400 million USD | 600 |
| Reconstruction of Mary–Serhetabat Road | None | None | 330 |
| Reconstruction of Turkmenabat–Gazachak–Dashoguz Road | 2015 | None | 541 |
| Reconstruction of Turkmenbashi–Karabagaz–Kazakhstan Border Road | 2015 | None | 240 |
Unit Cost Road Projects
Road Transport Policy Landscape
Road Transport Policy Targets
| Voluntary National Review - TKM | 2028 | in order to strengthen the rural transport system in 2022–2028, the construction and reconstruction of 3,43304 km of motorways will be carried out; |
| Voluntary National Review - TKM | 2028 | By 2028, the construction and reconstruction of 3,433.04 km of motorways In addition, the construction of the Ashgabat–Turkmenabat highspeed highway, as well as the construction of the Ashgabat–Turkmenbashi high-speed highway, and other highways are underway |
Road Transport Policy Measure Types
References
AIIB. (n.d.). MEASURING TRANSPORT CONNECTIVITY FOR TRADE IN ASIA. https://impact.economist.com/perspectives/sites/default/files/eco141_aiib_transport_connectivity_4.pdf/
Asian Transport Observatory. (2025). Asia and the Pacific's Transport Infrastructure and Investment Outlook 2035. https://asiantransportobservatory.org/analytical-outputs/asia-transport-infrastructure-investment-needs/
Barrington-Leigh, C., & Millard-Ball, A. (2025). A high-resolution global time series of street-network sprawl. https://journals.sagepub.com/doi/10.1177/23998083241306829
CDRI. (2023). Global Infrastructure Risk Model and Resilience Index. https://giri.unepgrid.ch/
CIESIN. (2023a). Rural Access Index [Dataset]. https://sedac.ciesin.columbia.edu/data/set/sdgi-9-1-1-rai-2023
CIESIN. (2023b). SDG Indicator 11.2.1: Urban Access to Public Transport, 2023 Release: Sustainable Development Goal Indicators (SDGI). https://sedac.ciesin.columbia.edu/data/set/sdgi-11-2-1-urban-access-public-transport-2023
EDGAR. (2025). GHG emissions of all world countries: 2025. Publications Office. https://data.europa.eu/doi/10.2760/9816914
Ember. (2024). Electricity Data Explorer [Dataset]. https://ember-energy.org/data/electricity-data-explorer
EM-DAT. (2025). EM-DAT - The international disaster database. https://www.emdat.be/European Commission. (2024). Global Air Pollutant Emissions EDGAR v8.1 [Dataset]. https://edgar.jrc.ec.europa.eu/dataset_ap61#sources
IEA. (n.d.). Fossil Fuel Subsidies. IEA. Retrieved April 19, 2025, from https://www.iea.org/topics/fossil-fuel-subsidies
ILO. (2025). ILOSTAT [Dataset]. https://rplumber.ilo.org/files/website/bulk/indicator.html
ITDP. (2024). The Atlas of Sustainable City Transport. https://atlas.itdp.org/
Koks, E., Rozenberg, J., Tariverdi, M., Dickens, B., Fox, C., Ginkel, K. van, & Hallegatte, S. (2023). A global assessment of national road network vulnerability. Environmental Research: Infrastructure and Sustainability, 3(2), 025008. https://doi.org/10.1088/2634-4505/acd1aa
Liu, K., Wang, Q., Wang, M., & Koks, E. E. (2023). Global transportation infrastructure exposure to the change of precipitation in a warmer world. Nature Communications, 14(1), 2541. https://doi.org/10.1038/s41467-023-38203-3
McDuffie, E. E., Martin, R. V., Spadaro, J. V., Burnett, R., Smith, S. J., O'Rourke, P., Hammer, M. S., van Donkelaar, A., Bindle, L., Shah, V., Jaeglé, L., Luo, G., Yu, F., Adeniran, J. A., Lin, J., & Brauer, M. (2021). Source sector and fuel contributions to ambient PM2.5 and attributable mortality across multiple spatial scales. Nature Communications, 12(1), 3594. https://doi.org/10.1038/s41467-021-23853-y
Parry, S. B., Antung A. Liu,Ian W. H. (2023). IMF Fossil Fuel Subsidies Data: 2023 Update. IMF. https://www.imf.org/en/publications/wp/issues/2023/08/22/imf-fossil-fuel-subsidies-data-2023-update-537281
Simkins, A. T., Beresford, A. E., Buchanan, G. M., Crowe, O., Elliott, W., Izquierdo, P., Patterson, D. J., & Butchart, S. H. M. (2023). A global assessment of the prevalence of current and potential future infrastructure in Key Biodiversity Areas. Biological Conservation, 281, 109953. https://doi.org/10.1016/j.biocon.2023.109953
Sims, M., Stanimirova, R., Neumann, M., Raichuk, A., & Purves, D. (2025). New Data Shows What's Driving Forest Loss Around the World. https://www.wri.org/insights/forest-loss-drivers-data-trends
Trademap. (2025). Trade Map. Trade Map. https://www.trademap.org/Index.aspx
UN DESA. (n.d.). Economic and Environmental Vulnerability Indicators. Retrieved January 26, 2026, from https://policy.desa.un.org/themes/least-developed-countries-category/ldc-identification-criteria-indicators/evi-indicators
UN DESA. (2025). 2024 Revision of World Population Prospects. https://population.un.org/wpp/
UN Energy Statistics. (2025). Energy Balance Visualization [Dataset]. https://unstats.un.org/unsd/energystats/dataPortal/
UNEP. (2021, May 12). Domestic material consumption (DMC) and DMC per capita, per GDP (Tier I). https://www.unep.org/indicator-1222
Weiss, D. J., Nelson, A., Gibson, H. S., Temperley, W., Peedell, S., Lieber, A., Hancher, M., Poyart, E., Belchior, S., Fullman, N., Mappin, B., Dalrymple, U., Rozier, J., Lucas, T. C. D., Howes, R. E., Tusting, L. S., Kang, S. Y., Cameron, E., Bisanzio, D., … Gething, P. W. (2018). A global map of travel time to cities to assess inequalities in accessibility in 2015. Nature, 553(7688), 333-336. https://doi.org/10.1038/nature25181
WHO. (2023). Global Status Report on Road Safety 2023. https://www.who.int/teams/social-determinants-of-health/safety-and-mobility/global-status-report-on-road-safety-2023
Wiedenhofer, D., Baumgart, A., Matej, S., Virág, D., Kalt, G., Lanau, M., Tingley, D. D., Liu, Z., Guo, J., Tanikawa, H., & Haberl, H. (2024). Mapping and modelling global mobility infrastructure stocks, material flows and their embodied greenhouse gas emissions [Dataset]. https://doi.org/10.1016/j.jclepro.2023.139742
World Bank. (2021). ICP 2021. https://databank.worldbank.org/source/icp-2021
World Bank. (2022a). Annual freshwater withdrawals, total (% of internal resources) [Dataset]. https://data.worldbank.org
World Bank. (2022b). Land area (sq. Km) [Dataset]. https://data.worldbank.org
World Bank. (2022c). The Global Health Cost of PM2.5 Air Pollution: A Case for Action Beyond 2021. The World Bank. https://doi.org/10.1596/978-1-4648-1816-5
World Bank. (2023). Forest area (% of land area) [Dataset]. https://data.worldbank.org/indicator/AG.LND.FRST.ZS
World Bank. (2024). Home | Logistics Performance Index (LPI). Logistics Performance Index. https://lpi.worldbank.org/
World Bank. (2025a). GDP per capita, PPP (current international $) [Dataset]. https://data.worldbank.org/indicator/NY.GDP.PCAP.PP.CD
World Bank. (2025b). GDP, PPP (current international $) [Dataset]. https://data.worldbank.org/indicator/NY.GDP.MKTP.PP.CD
World Database on Protected Areas. (2024). Protected Areas (WDPA) [Dataset]. https://www.protectedplanet.net/en/thematic-areas/wdpa?tab=WDPA