
Tonga Green Roads Profile 2025
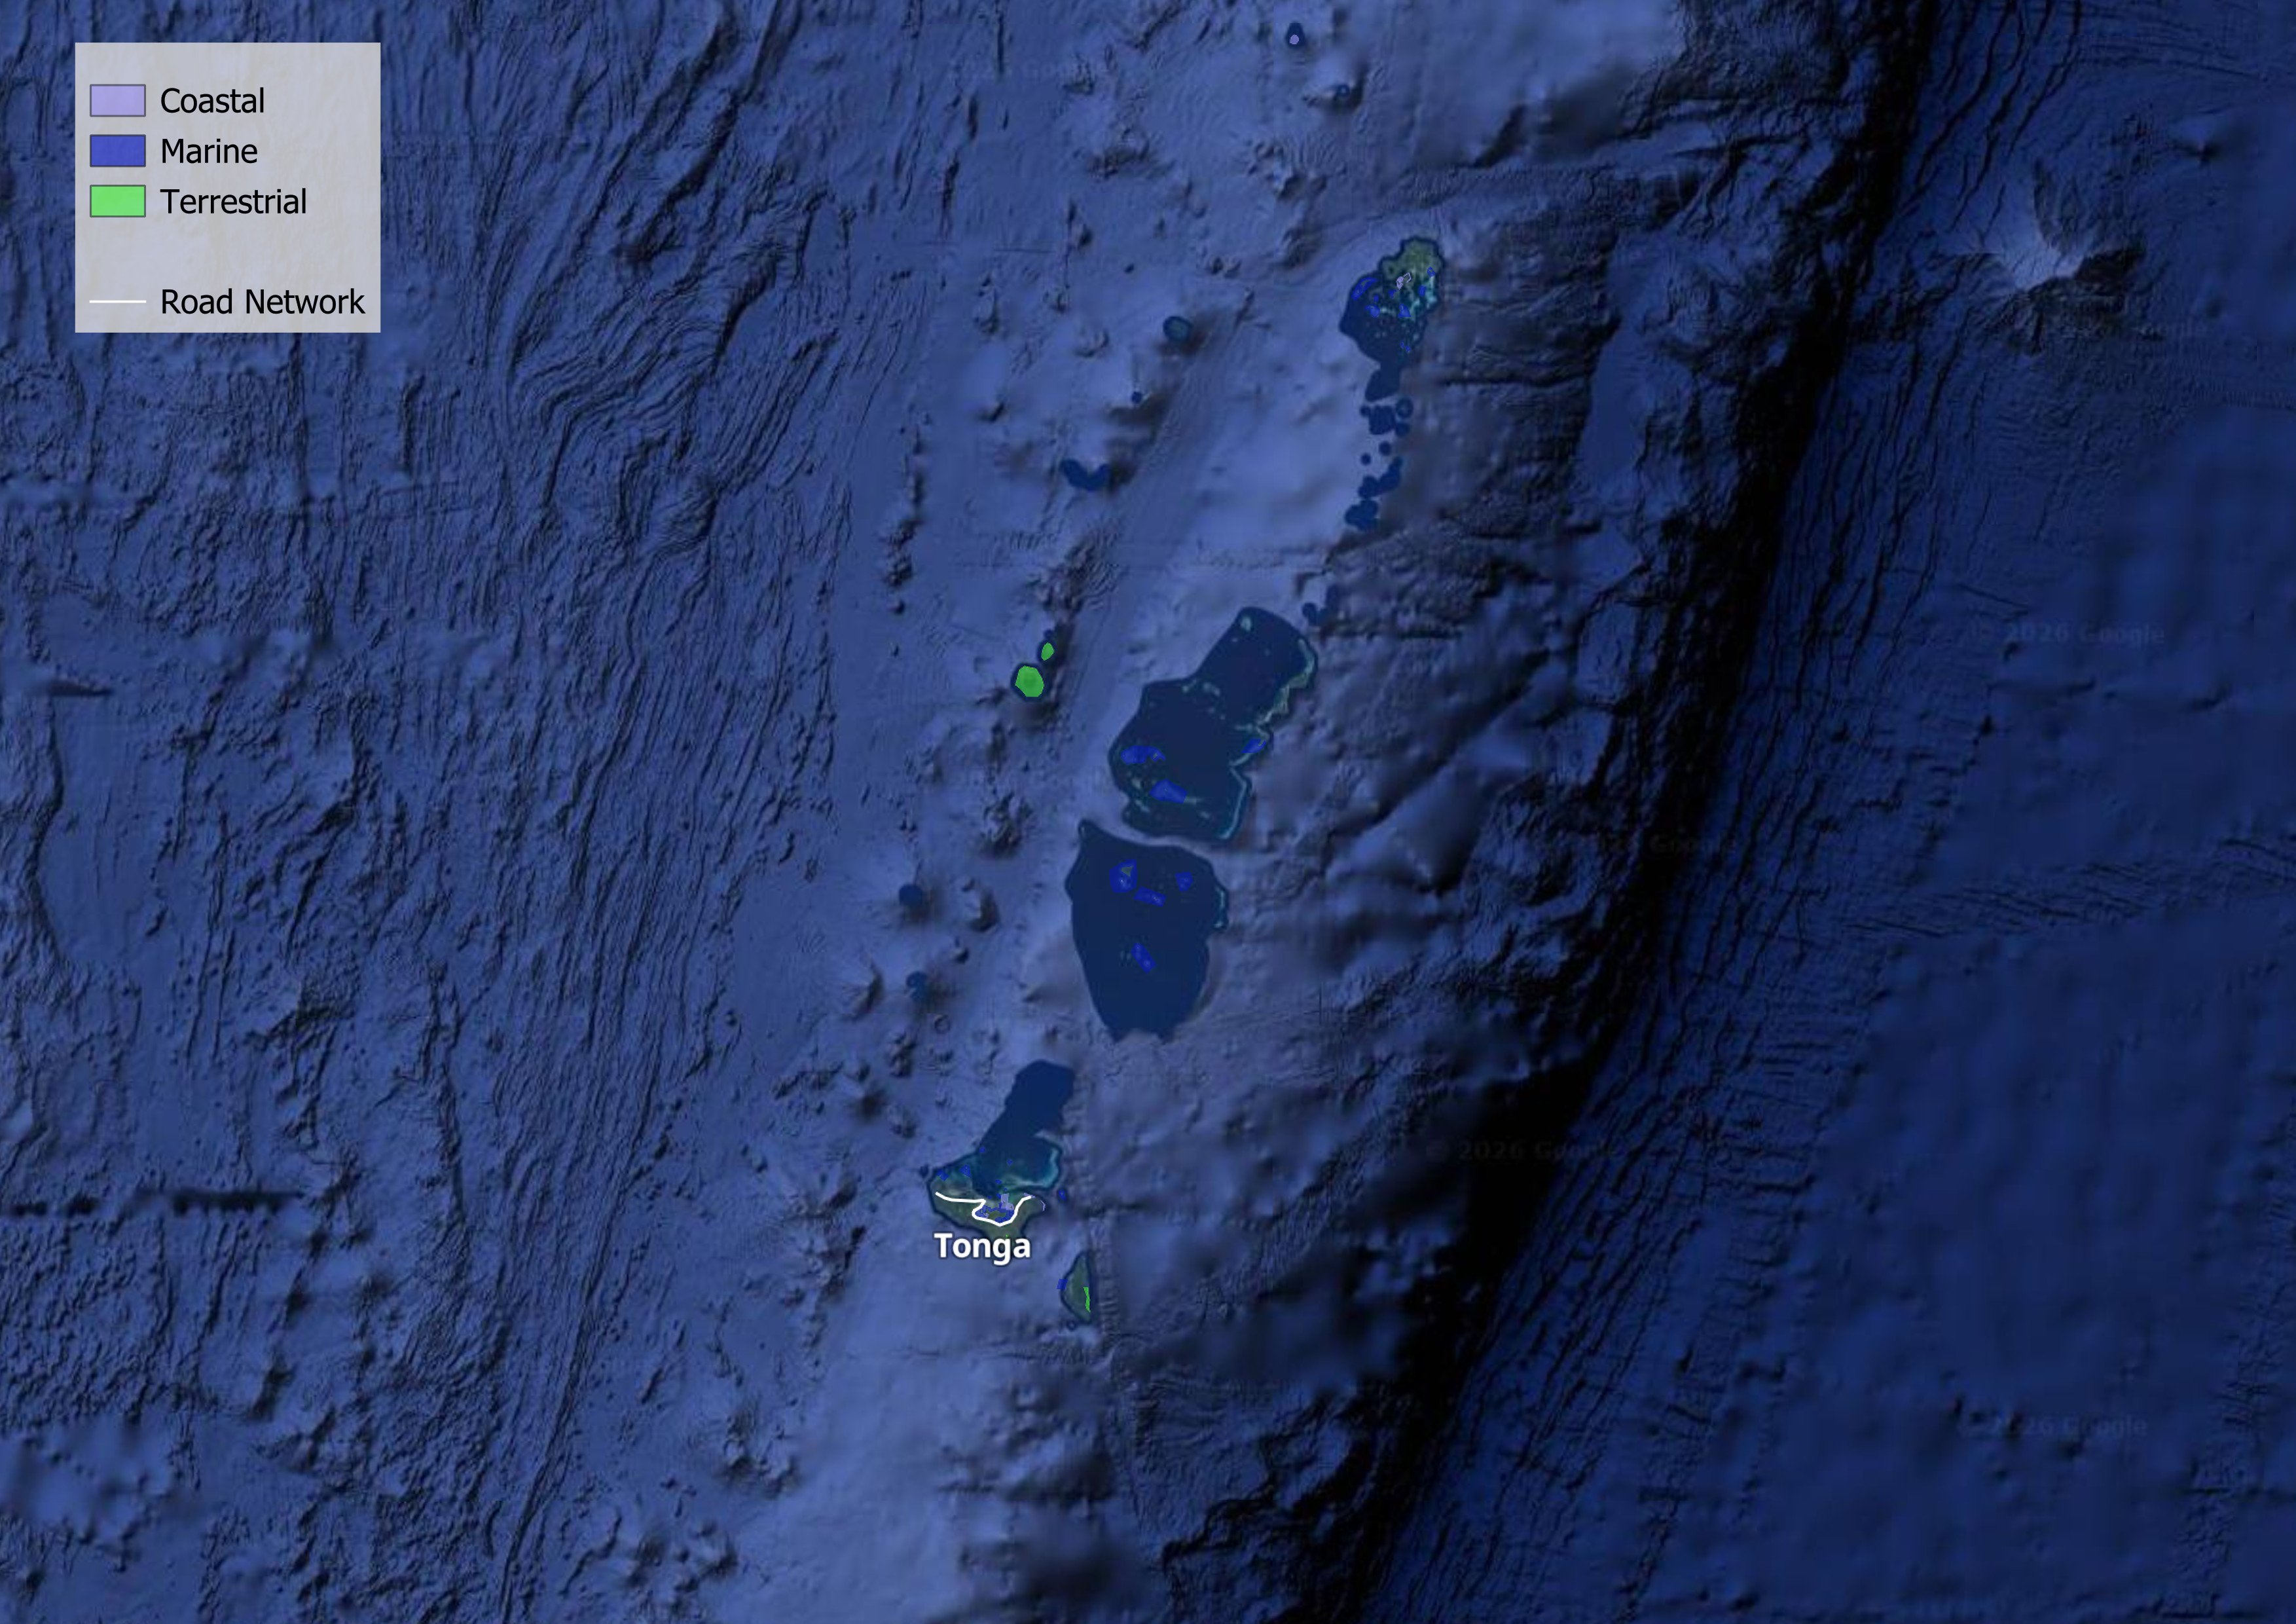
TONGA
GREEN ROADS PROFILESupported by:
The ATO green roads profiles present country-level perspectives on how 35 Asia-Pacific economies are addressing the development and management of sustainable eco-friendly roads. Drawing from diverse datasets and policy documents, the profiles highlight practices and measures that contribute to greener transport infrastructure.
Developed by the Asian Transport Observatory (ATO) in partnership with the International Road Federation (IRF), the profiles are designed to complement the Green Roads Toolkit. The toolkit provides a practical reference for integrating good practices across nine dimensions:
- Decarbonization
- Climate resilience
- Water and land management
- Pollution reduction
- Conserving biodiversity
- Responsible sourcing of materials
- Improving quality of life
- Disaster preparedness
- Fostering inclusive growth
This 2025 edition builds on earlier work to provide a comprehensive resource for guiding the planning, development, construction, and management of greener, more sustainable roads.
Background
Indicator - Dimension Matrix

Tonga's transportation system is characterized by a dense network of local roads rather than expansive motorways. Covering about 720 square kilometers, the country's 1,200 kilometers of roads lack any motorways or main highways. Instead, 94% of these roads are local and rural, resulting in a density of 1,727 meters per square kilometer. This infrastructure setup creates a paradox: although the physical network is compact, the environmental and economic impacts are growing quickly, highlighting the need for "Green Roads" that focus on resilience and reducing carbon emissions rather than just expansion.
The urgency for this transition is driven by a decoupling of transport emissions from broader economic trends. Since 2000, road transport greenhouse gas (GHG) emissions in Tonga have grown by 4.2% annually, significantly outpacing the economy-wide emissions growth of 1.4% per year. By 2024, road transport accounted for 86% of total transport emissions and nearly a quarter of the nation's entire GHG inventory. More concerning for policymakers is the efficiency trajectory; while the Asia-Pacific region improved its emissions intensity by 5.4% annually since 2015, Tonga's intensity remained largely stagnant, improving by only 0.2%. With an emissions intensity of 86 grams of CO2e per USD—more than triple the Asia-Pacific average of 26—the sector remains heavily carbon-intensive.
Underpinning these emissions is a fleet composition that suggests a clear pathway for electrification, provided market barriers can be overcome. The road network is dominated by two-wheelers (52%) and light-duty vehicles (33%), with buses constituting only 1%. Despite this favourable profile for electric mobility, market penetration remains negligible. Between 2015 and 2024, the value of electric vehicle imports totalled just 258 thousand USD, representing less than 1% of total road vehicle imports in 2024. The UNEP E-mobility Readiness Index scores Tonga at 58 out of 100, highlighting a stark disparity: while policy and energy readiness score a moderate 20, technology and market readiness lag significantly at just 5.
Beyond mitigation, the "Green Roads" agenda in Tonga is existentially linked to climate adaptation and infrastructure resilience. The country ranks 175th out of 208 nations in the National Road Vulnerability Index, reflecting a system where the loss of key segments to natural hazards can lead to catastrophic connectivity failures. Since 2000, the country has weathered 12 recorded natural disasters—primarily storms (75%)—affecting 225,000 people and costing nearly $400,000.
The economic toll of this vulnerability is chronic. Tonga faces estimated average annual losses of 530.7 thousand USD to transport infrastructure, roughly 0.065% of GDP, with 61% of these losses related specifically to roads. Bridges are disproportionately exposed; despite accounting for a negligible fraction of the infrastructure stock, they bear 10.5% of the road sector's financial losses. Furthermore, material flows indicate an annual requirement of 144 thousand tonnes of material for expansion and maintenance, embodying 4 thousand tonnes of CO2-equivalent emissions, further linking physical resilience with the carbon cycle.
The human cost of the current transport system reinforces the need for reform. Congestion accounts for 62% of the externalities associated with fuel subsidies, while road crashes account for 38%. Air pollution presents a silent economic burden; the World Bank estimates the annual cost of health damages from PM 2.5 exposure at 31 million USD, or about 5% of GDP. Although road transport contributes only 20% of the sector's PM 2.5 emissions, the concentration of these emissions in populated areas exacerbates the health impact.
Social inclusion remains the final pillar of the Green Roads framework. Currently, 3,000 rural residents live beyond the reach of all-season roads, isolating them from essential services and slowing disaster recovery. Access to urban centers is equally constrained, with nearly 100% of the population requiring more than 30 minutes to reach cities. Furthermore, the sector shows gender disparities, with women comprising only 28.9% of the transport workforce.
Achieving a sustainable transport future in Tonga requires navigating a complex interplay of high motorization rates—491 vehicles per thousand population—and fragile infrastructure. The data indicates that a "Business as Usual" approach will result in escalating maintenance costs, rising emissions intensity, and continued vulnerability to climate shocks.
Decarbonization
Climate Resilience
Water and Land Management
Reducing Pollution
Preserving Biodiversity
Sustainable Materials Sourcing and Construction Practices
Improving Quality of life
Disaster Preparedness
Fostering Inclusive Growth
Supporting Information
Road Infrastructure Pipeline
| Fanga'uta Lagoon Bridge Project | 2025 | None | None |
| Widening Taufaʻahau Road (Pea to Tofoa) to Three Lanes | None | None | None |
Unit Cost Road Projects
Road Transport Policy Landscape
Road Transport Policy Targets
No data
Road Transport Policy Measure Types
References
AIIB. (n.d.). MEASURING TRANSPORT CONNECTIVITY FOR TRADE IN ASIA. https://impact.economist.com/perspectives/sites/default/files/eco141_aiib_transport_connectivity_4.pdf/
Asian Transport Observatory. (2025). Asia and the Pacific's Transport Infrastructure and Investment Outlook 2035. https://asiantransportobservatory.org/analytical-outputs/asia-transport-infrastructure-investment-needs/
Barrington-Leigh, C., & Millard-Ball, A. (2025). A high-resolution global time series of street-network sprawl. https://journals.sagepub.com/doi/10.1177/23998083241306829
CDRI. (2023). Global Infrastructure Risk Model and Resilience Index. https://giri.unepgrid.ch/
CIESIN. (2023a). Rural Access Index [Dataset]. https://sedac.ciesin.columbia.edu/data/set/sdgi-9-1-1-rai-2023
CIESIN. (2023b). SDG Indicator 11.2.1: Urban Access to Public Transport, 2023 Release: Sustainable Development Goal Indicators (SDGI). https://sedac.ciesin.columbia.edu/data/set/sdgi-11-2-1-urban-access-public-transport-2023
EDGAR. (2025). GHG emissions of all world countries: 2025. Publications Office. https://data.europa.eu/doi/10.2760/9816914
Ember. (2024). Electricity Data Explorer [Dataset]. https://ember-energy.org/data/electricity-data-explorer
EM-DAT. (2025). EM-DAT - The international disaster database. https://www.emdat.be/European Commission. (2024). Global Air Pollutant Emissions EDGAR v8.1 [Dataset]. https://edgar.jrc.ec.europa.eu/dataset_ap61#sources
IEA. (n.d.). Fossil Fuel Subsidies. IEA. Retrieved April 19, 2025, from https://www.iea.org/topics/fossil-fuel-subsidies
ILO. (2025). ILOSTAT [Dataset]. https://rplumber.ilo.org/files/website/bulk/indicator.html
ITDP. (2024). The Atlas of Sustainable City Transport. https://atlas.itdp.org/
Koks, E., Rozenberg, J., Tariverdi, M., Dickens, B., Fox, C., Ginkel, K. van, & Hallegatte, S. (2023). A global assessment of national road network vulnerability. Environmental Research: Infrastructure and Sustainability, 3(2), 025008. https://doi.org/10.1088/2634-4505/acd1aa
Liu, K., Wang, Q., Wang, M., & Koks, E. E. (2023). Global transportation infrastructure exposure to the change of precipitation in a warmer world. Nature Communications, 14(1), 2541. https://doi.org/10.1038/s41467-023-38203-3
McDuffie, E. E., Martin, R. V., Spadaro, J. V., Burnett, R., Smith, S. J., O'Rourke, P., Hammer, M. S., van Donkelaar, A., Bindle, L., Shah, V., Jaeglé, L., Luo, G., Yu, F., Adeniran, J. A., Lin, J., & Brauer, M. (2021). Source sector and fuel contributions to ambient PM2.5 and attributable mortality across multiple spatial scales. Nature Communications, 12(1), 3594. https://doi.org/10.1038/s41467-021-23853-y
Parry, S. B., Antung A. Liu,Ian W. H. (2023). IMF Fossil Fuel Subsidies Data: 2023 Update. IMF. https://www.imf.org/en/publications/wp/issues/2023/08/22/imf-fossil-fuel-subsidies-data-2023-update-537281
Simkins, A. T., Beresford, A. E., Buchanan, G. M., Crowe, O., Elliott, W., Izquierdo, P., Patterson, D. J., & Butchart, S. H. M. (2023). A global assessment of the prevalence of current and potential future infrastructure in Key Biodiversity Areas. Biological Conservation, 281, 109953. https://doi.org/10.1016/j.biocon.2023.109953
Sims, M., Stanimirova, R., Neumann, M., Raichuk, A., & Purves, D. (2025). New Data Shows What's Driving Forest Loss Around the World. https://www.wri.org/insights/forest-loss-drivers-data-trends
Trademap. (2025). Trade Map. Trade Map. https://www.trademap.org/Index.aspx
UN DESA. (n.d.). Economic and Environmental Vulnerability Indicators. Retrieved January 26, 2026, from https://policy.desa.un.org/themes/least-developed-countries-category/ldc-identification-criteria-indicators/evi-indicators
UN DESA. (2025). 2024 Revision of World Population Prospects. https://population.un.org/wpp/
UN Energy Statistics. (2025). Energy Balance Visualization [Dataset]. https://unstats.un.org/unsd/energystats/dataPortal/
UNEP. (2021, May 12). Domestic material consumption (DMC) and DMC per capita, per GDP (Tier I). https://www.unep.org/indicator-1222
Weiss, D. J., Nelson, A., Gibson, H. S., Temperley, W., Peedell, S., Lieber, A., Hancher, M., Poyart, E., Belchior, S., Fullman, N., Mappin, B., Dalrymple, U., Rozier, J., Lucas, T. C. D., Howes, R. E., Tusting, L. S., Kang, S. Y., Cameron, E., Bisanzio, D., … Gething, P. W. (2018). A global map of travel time to cities to assess inequalities in accessibility in 2015. Nature, 553(7688), 333-336. https://doi.org/10.1038/nature25181
WHO. (2023). Global Status Report on Road Safety 2023. https://www.who.int/teams/social-determinants-of-health/safety-and-mobility/global-status-report-on-road-safety-2023
Wiedenhofer, D., Baumgart, A., Matej, S., Virág, D., Kalt, G., Lanau, M., Tingley, D. D., Liu, Z., Guo, J., Tanikawa, H., & Haberl, H. (2024). Mapping and modelling global mobility infrastructure stocks, material flows and their embodied greenhouse gas emissions [Dataset]. https://doi.org/10.1016/j.jclepro.2023.139742
World Bank. (2021). ICP 2021. https://databank.worldbank.org/source/icp-2021
World Bank. (2022a). Annual freshwater withdrawals, total (% of internal resources) [Dataset]. https://data.worldbank.org
World Bank. (2022b). Land area (sq. Km) [Dataset]. https://data.worldbank.org
World Bank. (2022c). The Global Health Cost of PM2.5 Air Pollution: A Case for Action Beyond 2021. The World Bank. https://doi.org/10.1596/978-1-4648-1816-5
World Bank. (2023). Forest area (% of land area) [Dataset]. https://data.worldbank.org/indicator/AG.LND.FRST.ZS
World Bank. (2024). Home | Logistics Performance Index (LPI). Logistics Performance Index. https://lpi.worldbank.org/
World Bank. (2025a). GDP per capita, PPP (current international $) [Dataset]. https://data.worldbank.org/indicator/NY.GDP.PCAP.PP.CD
World Bank. (2025b). GDP, PPP (current international $) [Dataset]. https://data.worldbank.org/indicator/NY.GDP.MKTP.PP.CD
World Database on Protected Areas. (2024). Protected Areas (WDPA) [Dataset]. https://www.protectedplanet.net/en/thematic-areas/wdpa?tab=WDPA