
Thailand Green Roads Profile 2025
THAILAND
GREEN ROADS PROFILESupported by:
The ATO green roads profiles present country-level perspectives on how 35 Asia-Pacific economies are addressing the development and management of sustainable eco-friendly roads. Drawing from diverse datasets and policy documents, the profiles highlight practices and measures that contribute to greener transport infrastructure.
Developed by the Asian Transport Observatory (ATO) in partnership with the International Road Federation (IRF), the profiles are designed to complement the Green Roads Toolkit. The toolkit provides a practical reference for integrating good practices across nine dimensions:
- Decarbonization
- Climate resilience
- Water and land management
- Pollution reduction
- Conserving biodiversity
- Responsible sourcing of materials
- Improving quality of life
- Disaster preparedness
- Fostering inclusive growth
This 2025 edition builds on earlier work to provide a comprehensive resource for guiding the planning, development, construction, and management of greener, more sustainable roads.
Background
Indicator - Dimension Matrix

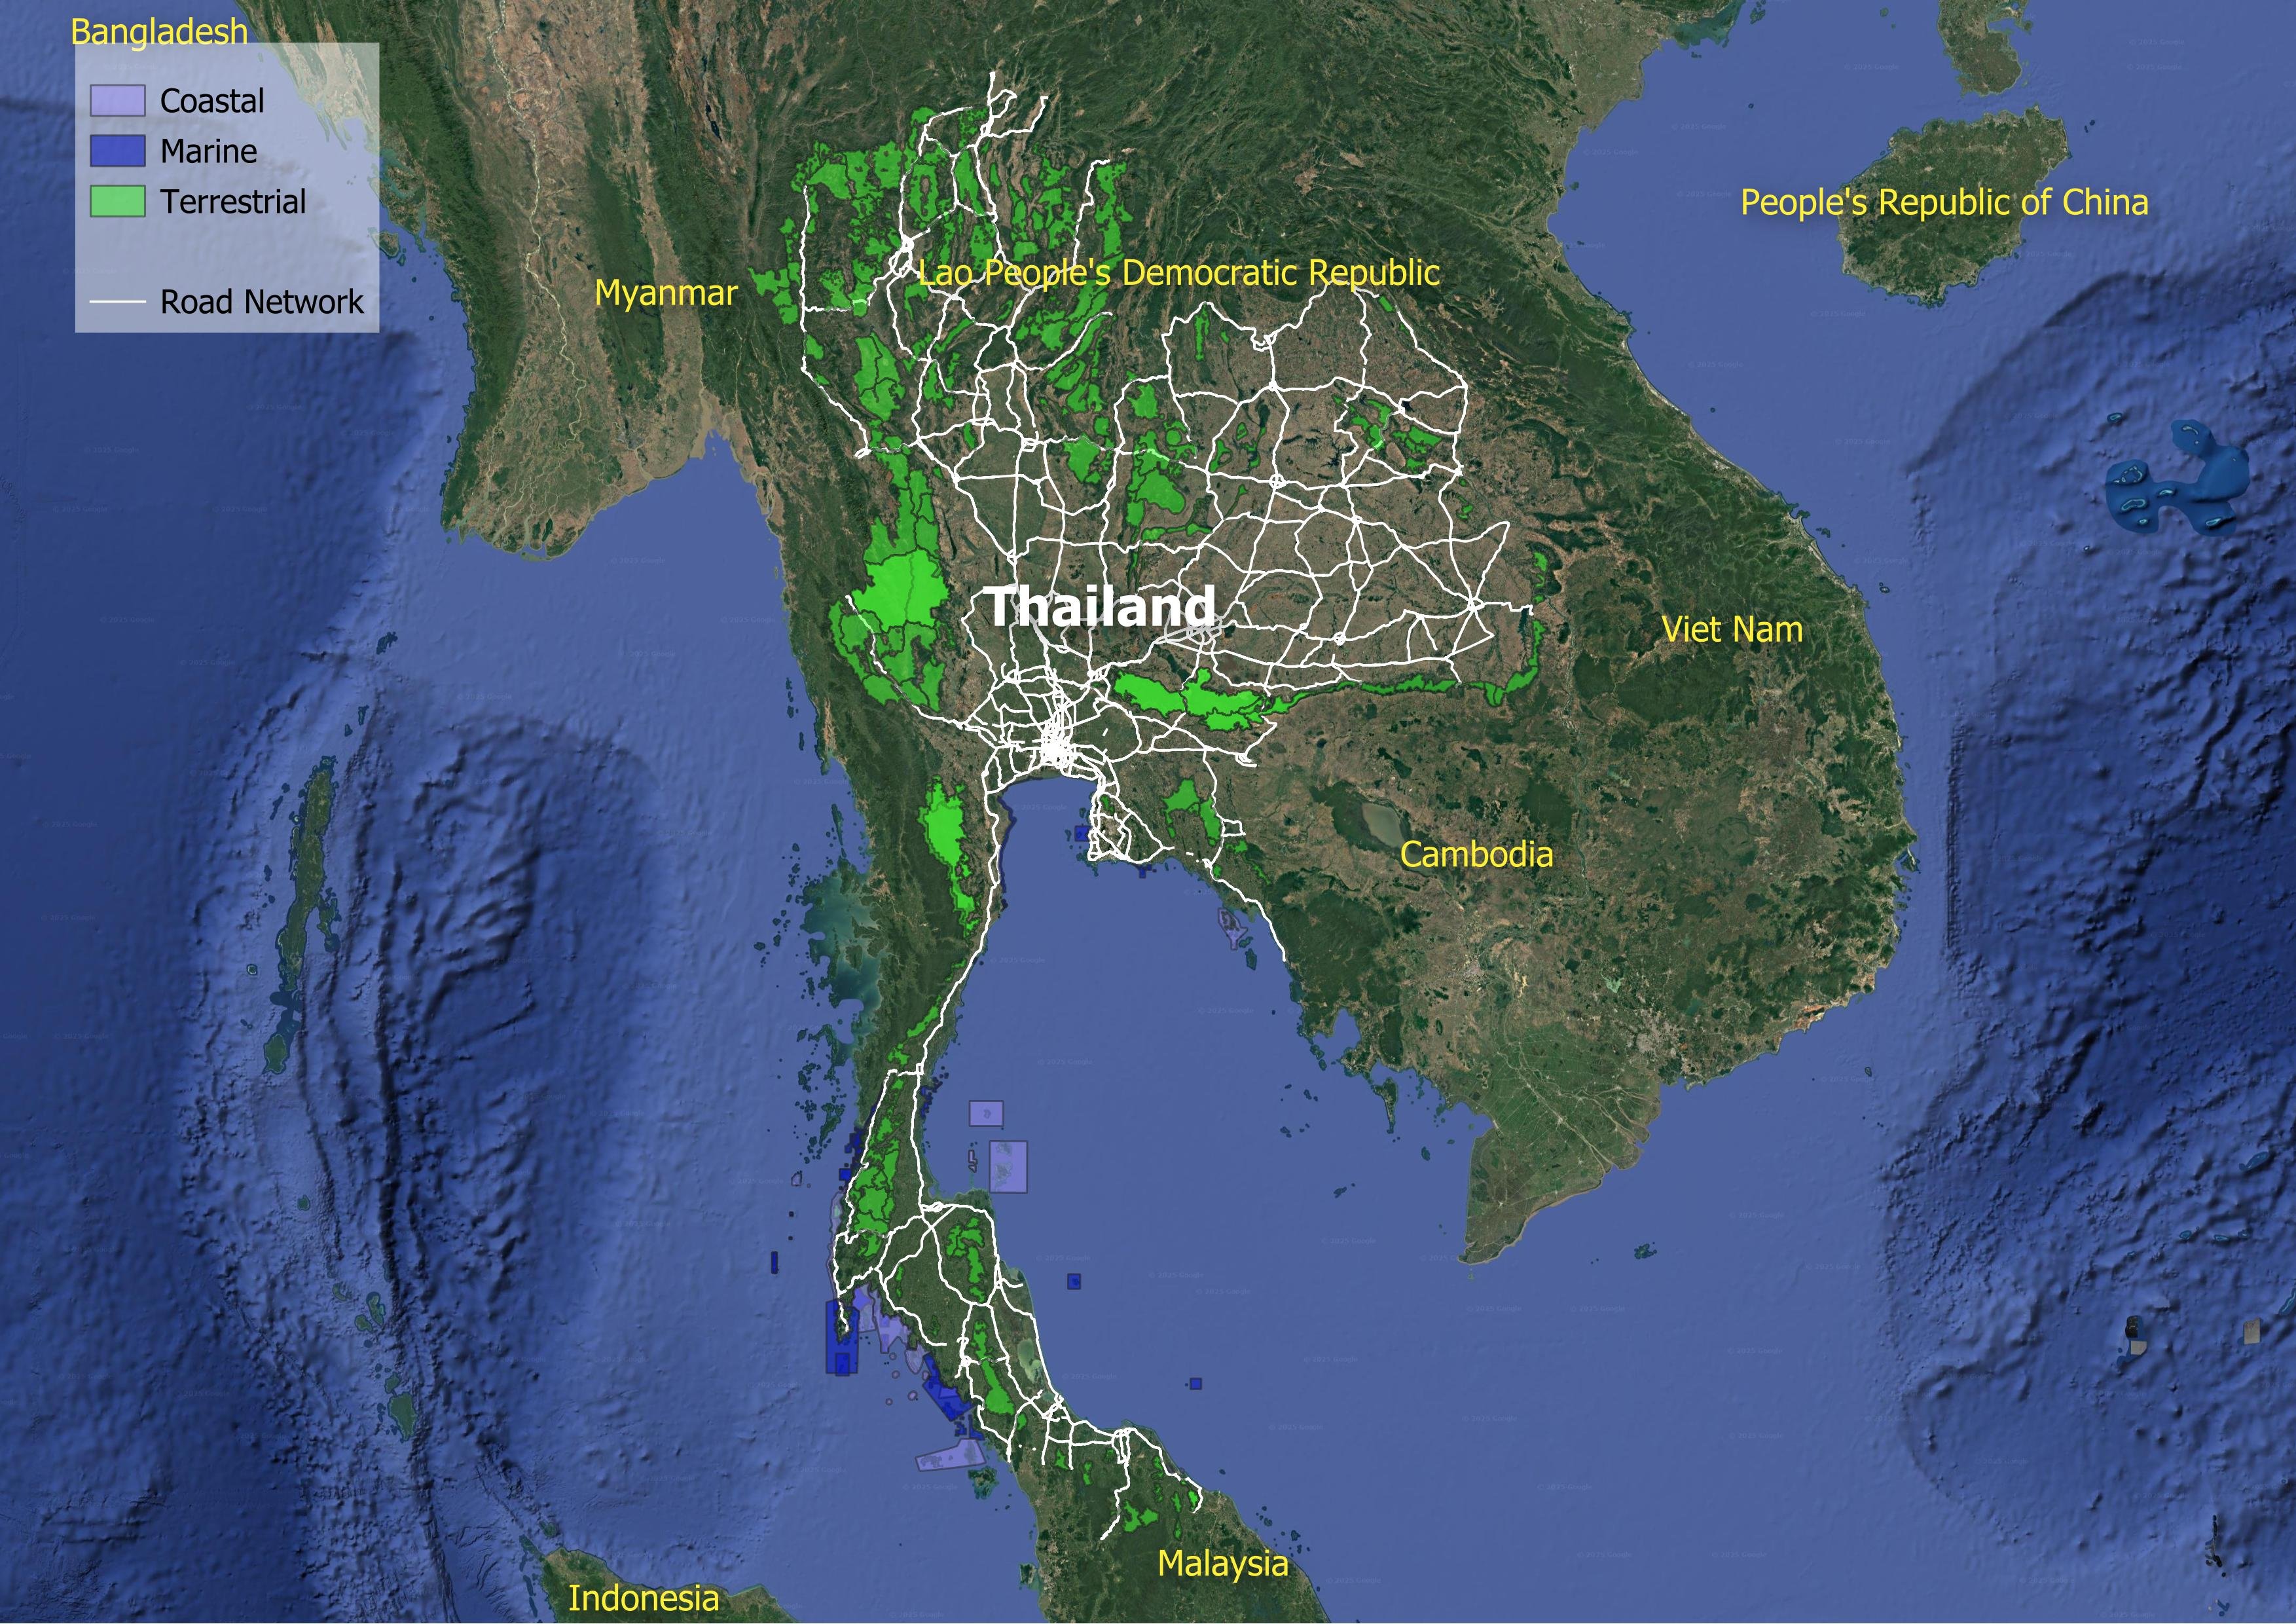
Thailand's road network spanning over 703,000 kilometers, serves as the undeniable backbone of the nation's connectivity. Composed largely of local and rural routes, which make up 92% of the total system, this infrastructure supports a density of 1,378 meters per square kilometer—a figure that speaks to decades of expansion. Yet, this physical asset is becoming a focal point for three converging crises: escalating greenhouse gas emissions, ecological fragmentation, and vulnerability to a volatile climate.
The carbon footprint of Thailand transport is overwhelmingly road-based. By 2024, road transport generated 81.1 million tonnes of CO2e, accounting for 96% of the sector's total emissions and 19% of the economy-wide total. While economy-wide emissions grew at 1.9% annually since 2000, road transport outpaced them, climbing at 2.5% per year. This trajectory is driven by high motorization rates—600 vehicles per thousand people, nearly double the Asia-Pacific average—and a fleet composition dominated by personal mobility. Two-wheelers (57%) and light-duty vehicles (40%), while buses represent a negligible fraction of the traffic mix, reflecting a systemic underinvestment in mass transit.
A pivot is visible, however. Thailand has emerged as a regional leader in electrification, scoring 82 out of 100 on UNEP's E-mobility Readiness Index. The market has responded swiftly; between 2015 and 2024, the value of EV imports reached 6.6 billion USD, capturing 50% of road vehicle imports by the end of that period. Yet, the decarbonization potential of these vehicles is tethered to the power sector. With a grid emission factor of 555 gCO2 per kWh, the new fleets are only marginally cleaner than the regional average, dampening the immediate climate benefits.
Beyond the tailpipe, the road network itself represents a massive accumulation of embodied carbon. The infrastructure stock contains approximately 3.07 billion tonnes of material, with annual maintenance and expansion adding another 79 million tonnes—equivalent to 2.7 million tonnes of embodied CO2e every year. This physical footprint weighs heavily on Thailand's biodiversity. Of the country's 114 Key Biodiversity Areas (KBAs), 102 have been bisected by road infrastructure, creating a density of 387 meters of road per thousand square kilometers within these sensitive zones—far exceeding the Southeast Asian average of 83. Current mapping of 61 pending road projects suggests further risks, potentially endangering over 5 million tonnes of carbon stocks and compromising nitrogen retention critical for vegetation.
Climate resilience is the other side of the infrastructure coin. Under a 4.5-degree warming scenario, nearly 88% of Thailand's road and rail assets face exposure to intensified precipitation. The economic implications are already tangible. Average annual losses to transport infrastructure are estimated at 125.8 million USD, with roads absorbing 78% of this damage. Bridges and tunnels serve as critical failure points; despite accounting for only 0.3% of the infrastructure, they suffer 5.4% of the losses. This vulnerability extends to the rural population, where 2.2 million people remain beyond the reach of all-season roads, leaving them isolated during disaster events and severing access to markets and healthcare.
Safety remains the most immediate human crisis. The current mobility model extracts a severe toll, with the World Health Organization estimating 18,218 road crash fatalities in 2021. The impact of road crashes extends far beyond human suffering. These fatalities and serious injuries cost Thailand approximately 36 billion USD in 2021, roughly 7% of the country's GDP. For comparison, healthcare expenditure in Thailand in the same year amounted to only 5.2% of its GDP. In Thailand, road crash fatalities decreased by approximately -5.9% per year between 2016 and 2021. However, this is not enough to reach the 2030 target to halve the fatalities by 2030
Simultaneously, urban accessibility is skewed. In 63% of cities with data available, only two out of ten residents have access to public transport, and merely 33% of the urban population can access essential healthcare and education within a reasonable one-kilometer distance.
The transition to "green roads" in Thailand demands a systemic shift toward network efficiency—currently scoring just 0.63 out of 1.0—and a rigorous integration of biodiversity safeguards into infrastructure planning. Future policy must bridge the gap between rapid fleet electrification and the hardening of physical assets against climate shocks.
Decarbonization
Climate Resilience
Water and Land Management
Reducing Pollution
Preserving Biodiversity
Sustainable Materials Sourcing and Construction Practices
Improving Quality of life
Disaster Preparedness
Fostering Inclusive Growth
Supporting Information
Road Infrastructure Pipeline
| Climate-Resilient Connectivity for the Eastern Economic Corridor Project: The Intercity Motorway No. 7 (Extension to Link with U-Tapao International Airport) | 2024 | None | None |
| Pattaya – Map Ta Phut (Motorway 7 Extension) | None | 17.78 million THB | 31.159 |
Unit Cost Road Projects
Road Transport Policy Landscape
Road Transport Policy Targets
| The Thirteenth National Economic and Social Development Plan (2023-2027) | 2027 | The number of automotive workers upskilled to EVs and employed in the new industry increases by 5,000 by 2027. |
| Action Plan on Thailand Logistics Development 2023-2027 | 2027 | Customs (LPI) = Rank 25th or a score of not less than 3.20 Logistics Quality and Competence = Rank 25th or a score of not less than 3.60 E-commerce value of transport and logistics sectors = An average growth rate of 10 percent (2023-2027) |
| Action Plan on Thailand Logistics Development 2023-2027 | 2027 | Transport cost to GDP reduces to 5 percent |
| Strategies for the Development of Thailand's Transport System for a 20-Year Period (2018-2036) | 2036 | Logistics costs per gross domestic product (GDP) = Present (2016) 13.9% Target (2036) 11.9 percent Transportation costs per gross domestic product = Present (2016) 7.5% Target (2036) 6.7 percent |
Road Transport Policy Measure Types
References
AIIB. (n.d.). MEASURING TRANSPORT CONNECTIVITY FOR TRADE IN ASIA. https://impact.economist.com/perspectives/sites/default/files/eco141_aiib_transport_connectivity_4.pdf/
Asian Transport Observatory. (2025). Asia and the Pacific's Transport Infrastructure and Investment Outlook 2035. https://asiantransportobservatory.org/analytical-outputs/asia-transport-infrastructure-investment-needs/
Barrington-Leigh, C., & Millard-Ball, A. (2025). A high-resolution global time series of street-network sprawl. https://journals.sagepub.com/doi/10.1177/23998083241306829
CDRI. (2023). Global Infrastructure Risk Model and Resilience Index. https://giri.unepgrid.ch/
CIESIN. (2023a). Rural Access Index [Dataset]. https://sedac.ciesin.columbia.edu/data/set/sdgi-9-1-1-rai-2023
CIESIN. (2023b). SDG Indicator 11.2.1: Urban Access to Public Transport, 2023 Release: Sustainable Development Goal Indicators (SDGI). https://sedac.ciesin.columbia.edu/data/set/sdgi-11-2-1-urban-access-public-transport-2023
EDGAR. (2025). GHG emissions of all world countries: 2025. Publications Office. https://data.europa.eu/doi/10.2760/9816914
Ember. (2024). Electricity Data Explorer [Dataset]. https://ember-energy.org/data/electricity-data-explorer
EM-DAT. (2025). EM-DAT - The international disaster database. https://www.emdat.be/European Commission. (2024). Global Air Pollutant Emissions EDGAR v8.1 [Dataset]. https://edgar.jrc.ec.europa.eu/dataset_ap61#sources
IEA. (n.d.). Fossil Fuel Subsidies. IEA. Retrieved April 19, 2025, from https://www.iea.org/topics/fossil-fuel-subsidies
ILO. (2025). ILOSTAT [Dataset]. https://rplumber.ilo.org/files/website/bulk/indicator.html
ITDP. (2024). The Atlas of Sustainable City Transport. https://atlas.itdp.org/
Koks, E., Rozenberg, J., Tariverdi, M., Dickens, B., Fox, C., Ginkel, K. van, & Hallegatte, S. (2023). A global assessment of national road network vulnerability. Environmental Research: Infrastructure and Sustainability, 3(2), 025008. https://doi.org/10.1088/2634-4505/acd1aa
Liu, K., Wang, Q., Wang, M., & Koks, E. E. (2023). Global transportation infrastructure exposure to the change of precipitation in a warmer world. Nature Communications, 14(1), 2541. https://doi.org/10.1038/s41467-023-38203-3
McDuffie, E. E., Martin, R. V., Spadaro, J. V., Burnett, R., Smith, S. J., O'Rourke, P., Hammer, M. S., van Donkelaar, A., Bindle, L., Shah, V., Jaeglé, L., Luo, G., Yu, F., Adeniran, J. A., Lin, J., & Brauer, M. (2021). Source sector and fuel contributions to ambient PM2.5 and attributable mortality across multiple spatial scales. Nature Communications, 12(1), 3594. https://doi.org/10.1038/s41467-021-23853-y
Parry, S. B., Antung A. Liu,Ian W. H. (2023). IMF Fossil Fuel Subsidies Data: 2023 Update. IMF. https://www.imf.org/en/publications/wp/issues/2023/08/22/imf-fossil-fuel-subsidies-data-2023-update-537281
Simkins, A. T., Beresford, A. E., Buchanan, G. M., Crowe, O., Elliott, W., Izquierdo, P., Patterson, D. J., & Butchart, S. H. M. (2023). A global assessment of the prevalence of current and potential future infrastructure in Key Biodiversity Areas. Biological Conservation, 281, 109953. https://doi.org/10.1016/j.biocon.2023.109953
Sims, M., Stanimirova, R., Neumann, M., Raichuk, A., & Purves, D. (2025). New Data Shows What's Driving Forest Loss Around the World. https://www.wri.org/insights/forest-loss-drivers-data-trends
Trademap. (2025). Trade Map. Trade Map. https://www.trademap.org/Index.aspx
UN DESA. (n.d.). Economic and Environmental Vulnerability Indicators. Retrieved January 26, 2026, from https://policy.desa.un.org/themes/least-developed-countries-category/ldc-identification-criteria-indicators/evi-indicators
UN DESA. (2025). 2024 Revision of World Population Prospects. https://population.un.org/wpp/
UN Energy Statistics. (2025). Energy Balance Visualization [Dataset]. https://unstats.un.org/unsd/energystats/dataPortal/
UNEP. (2021, May 12). Domestic material consumption (DMC) and DMC per capita, per GDP (Tier I). https://www.unep.org/indicator-1222
Weiss, D. J., Nelson, A., Gibson, H. S., Temperley, W., Peedell, S., Lieber, A., Hancher, M., Poyart, E., Belchior, S., Fullman, N., Mappin, B., Dalrymple, U., Rozier, J., Lucas, T. C. D., Howes, R. E., Tusting, L. S., Kang, S. Y., Cameron, E., Bisanzio, D., … Gething, P. W. (2018). A global map of travel time to cities to assess inequalities in accessibility in 2015. Nature, 553(7688), 333-336. https://doi.org/10.1038/nature25181
WHO. (2023). Global Status Report on Road Safety 2023. https://www.who.int/teams/social-determinants-of-health/safety-and-mobility/global-status-report-on-road-safety-2023
Wiedenhofer, D., Baumgart, A., Matej, S., Virág, D., Kalt, G., Lanau, M., Tingley, D. D., Liu, Z., Guo, J., Tanikawa, H., & Haberl, H. (2024). Mapping and modelling global mobility infrastructure stocks, material flows and their embodied greenhouse gas emissions [Dataset]. https://doi.org/10.1016/j.jclepro.2023.139742
World Bank. (2021). ICP 2021. https://databank.worldbank.org/source/icp-2021
World Bank. (2022a). Annual freshwater withdrawals, total (% of internal resources) [Dataset]. https://data.worldbank.org
World Bank. (2022b). Land area (sq. Km) [Dataset]. https://data.worldbank.org
World Bank. (2022c). The Global Health Cost of PM2.5 Air Pollution: A Case for Action Beyond 2021. The World Bank. https://doi.org/10.1596/978-1-4648-1816-5
World Bank. (2023). Forest area (% of land area) [Dataset]. https://data.worldbank.org/indicator/AG.LND.FRST.ZS
World Bank. (2024). Home | Logistics Performance Index (LPI). Logistics Performance Index. https://lpi.worldbank.org/
World Bank. (2025a). GDP per capita, PPP (current international $) [Dataset]. https://data.worldbank.org/indicator/NY.GDP.PCAP.PP.CD
World Bank. (2025b). GDP, PPP (current international $) [Dataset]. https://data.worldbank.org/indicator/NY.GDP.MKTP.PP.CD
World Database on Protected Areas. (2024). Protected Areas (WDPA) [Dataset]. https://www.protectedplanet.net/en/thematic-areas/wdpa?tab=WDPA