
Tajikistan Green Roads Profile 2025
TAJIKISTAN
GREEN ROADS PROFILESupported by:
The ATO green roads profiles present country-level perspectives on how 35 Asia-Pacific economies are addressing the development and management of sustainable eco-friendly roads. Drawing from diverse datasets and policy documents, the profiles highlight practices and measures that contribute to greener transport infrastructure.
Developed by the Asian Transport Observatory (ATO) in partnership with the International Road Federation (IRF), the profiles are designed to complement the Green Roads Toolkit. The toolkit provides a practical reference for integrating good practices across nine dimensions:
- Decarbonization
- Climate resilience
- Water and land management
- Pollution reduction
- Conserving biodiversity
- Responsible sourcing of materials
- Improving quality of life
- Disaster preparedness
- Fostering inclusive growth
This 2025 edition builds on earlier work to provide a comprehensive resource for guiding the planning, development, construction, and management of greener, more sustainable roads.
Background
Indicator - Dimension Matrix

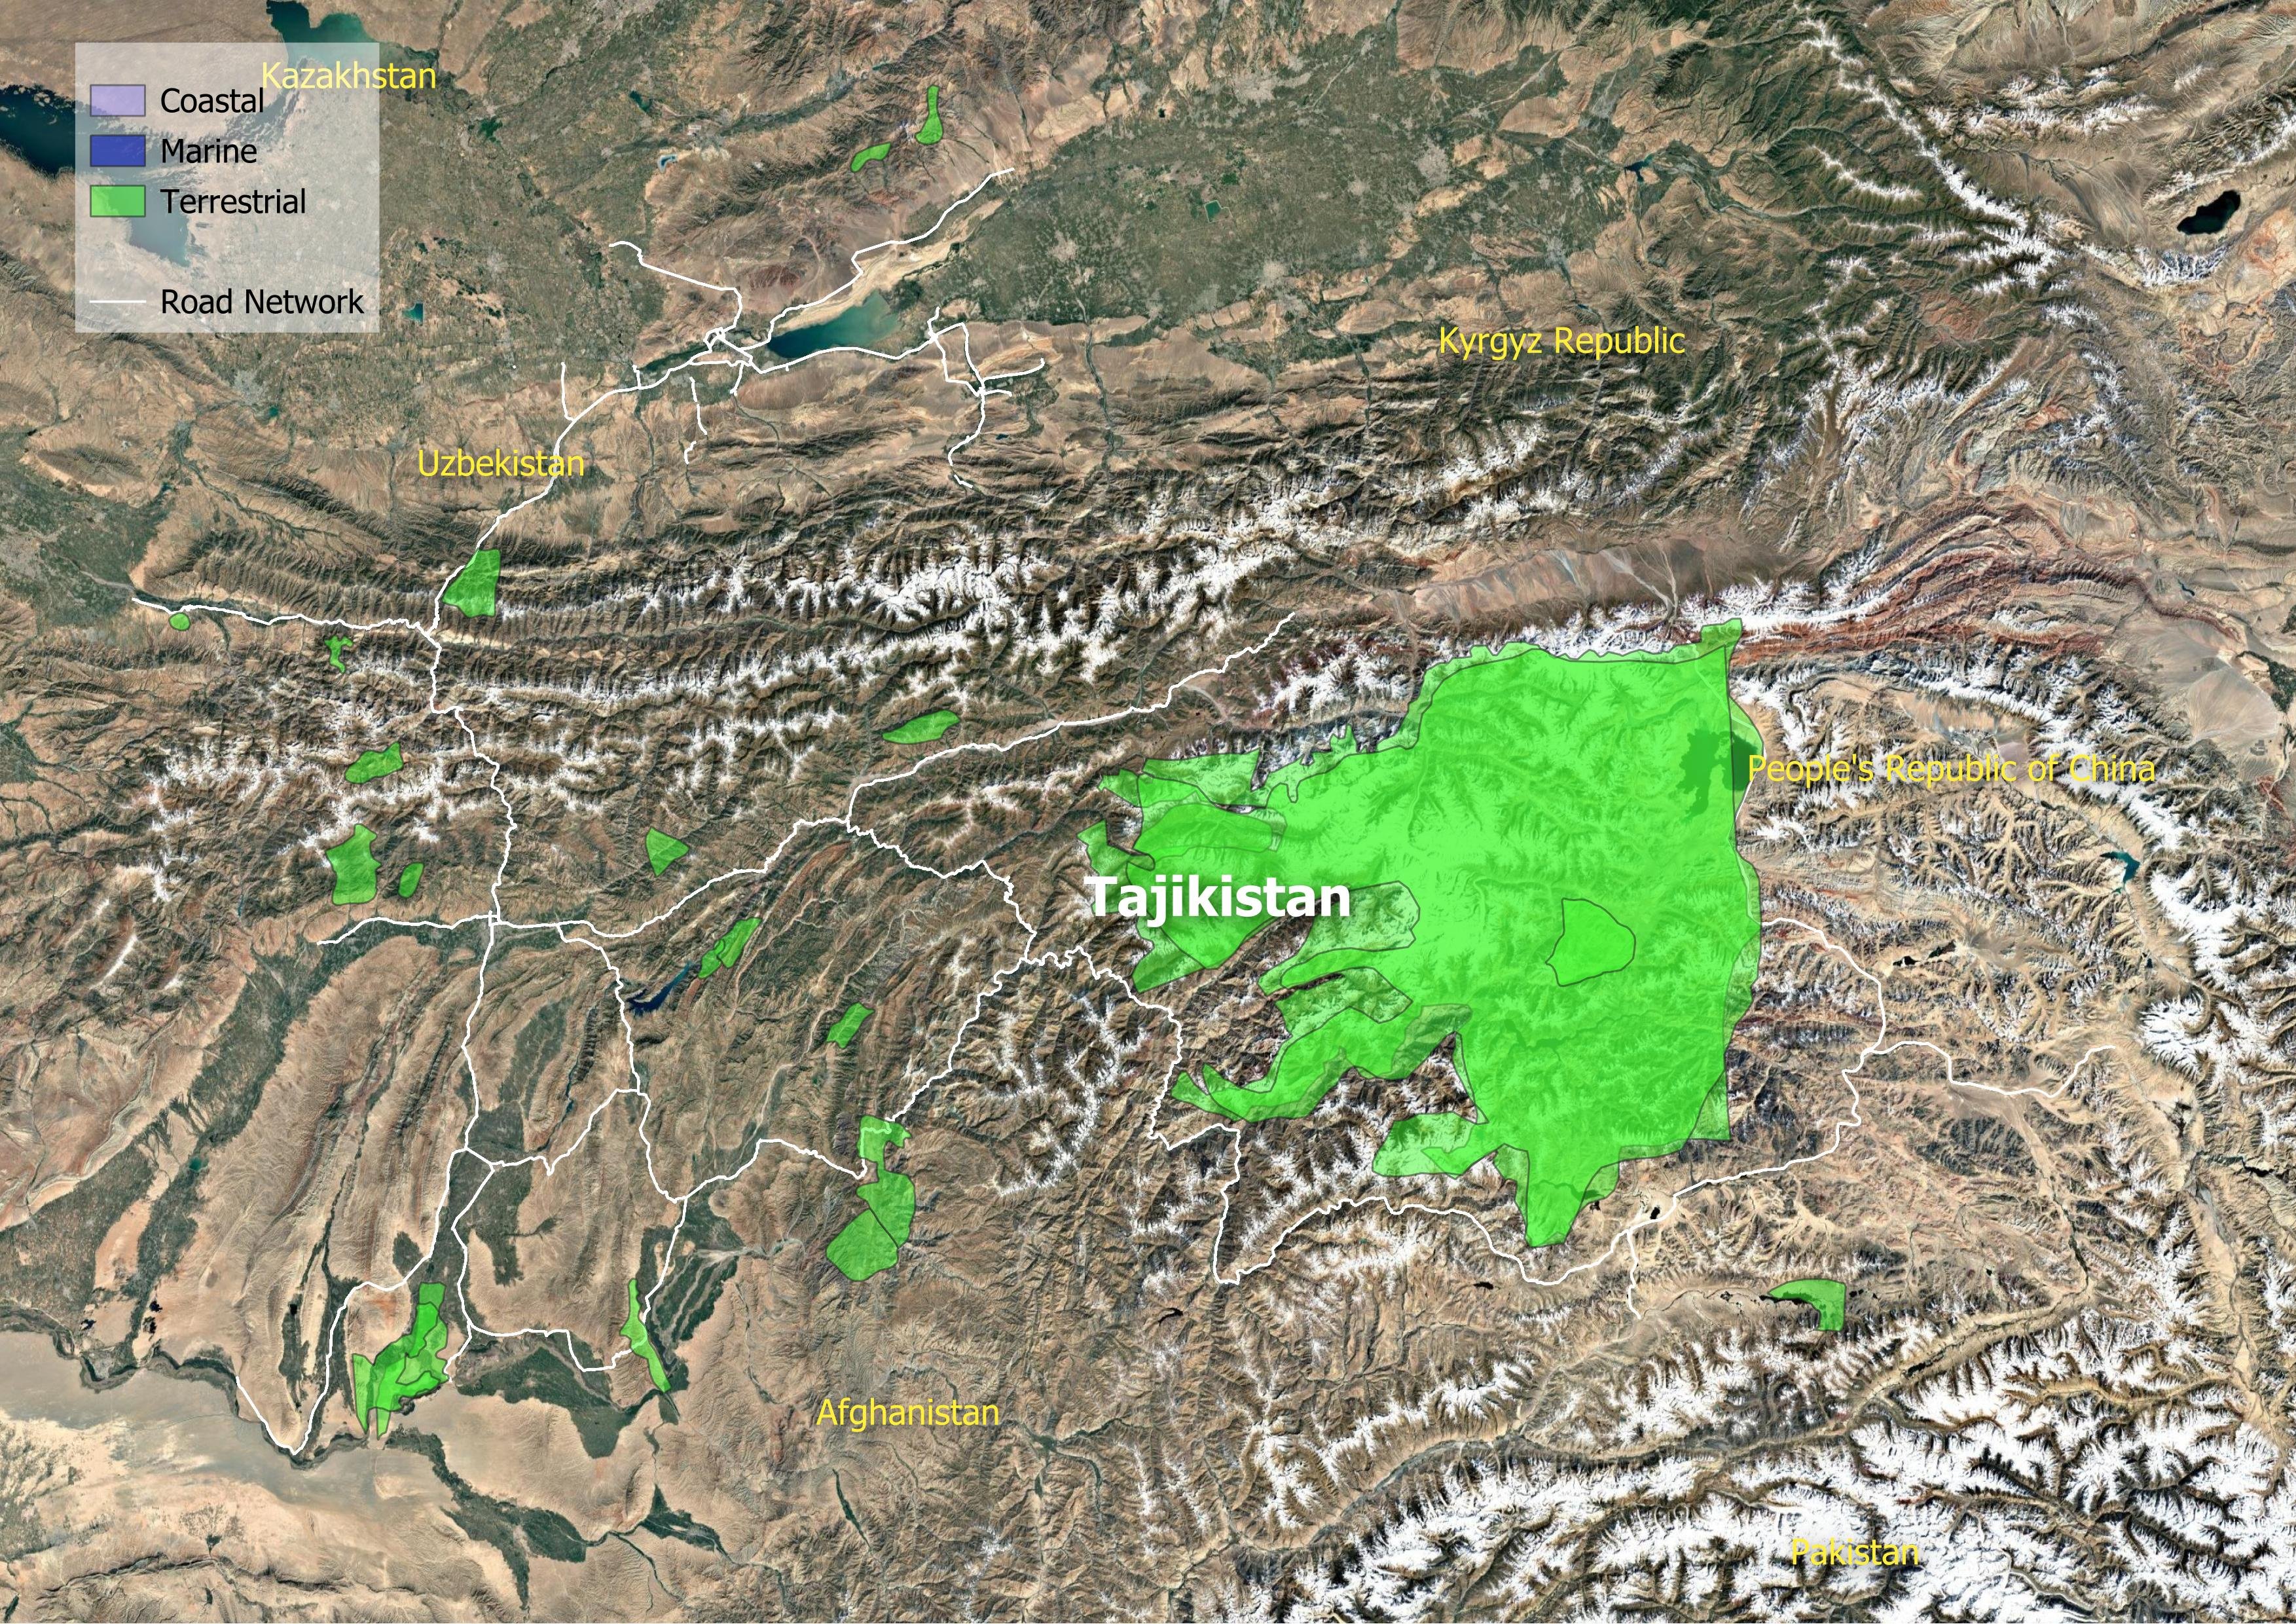
Tajikistan's rugged yet majestic landscape makes its road network crucial for the economy. Covering about 139,000 square kilometers, the country depends on 43,800 kilometers of roads to connect its communities. However, this infrastructure faces three main challenges: decarbonizing to meet climate goals, strengthening against climate volatility, and expanding access so no citizen is left behind.
The carbon profile of Tajikistan's transport sector presents a distinct paradox. The country sits on a formidable asset for decarbonization: a hydropower-dominated energy mix with a grid emission factor of just 98 gCO2 per kWh in 2024—drastically cleaner than the Asia-Pacific average of 559. However, the transport sector has not yet tapped into this clean reservoir. Instead, road transport accounts for the entirety of the sector's emissions and 10% of economy-wide greenhouse gas (GHG) output. More concerning is the trajectory; while economy-wide emissions grew at a manageable 3.2% annually since 2000, road transport emissions surged by 17.9% per year. This divergence suggests that without intervention, the transport sector will increasingly become the primary driver of the country's carbon liability.
The heavy reliance on fossil fuels extracts a high price beyond carbon. Subsidies for petroleum mask the true external costs to society, which manifest violently in road crashes (81% of external costs), congestion, and physical road damage. The human toll is significant, with the World Health Organization estimating 1,352 road crash fatalities in 2021. The economic burden of road crashes in Tajikistan is substantial. Fatalities and serious injuries cost an estimated 338 million USD in 2021, equivalent to roughly 4% of the country's GDP. This figure underscores the significant impact on the economy, families, productivity, and healthcare systems. In Tajikistan, road crash fatalities decreased by approximately -3.6% per year between 2016 and 2021. However, this is not enough to reach the 2030 target to halve the fatalities by 2030.
Simultaneously, the physical integrity of the network is under siege from environmental stressors. Since 2000, the country has weathered 57 recorded natural disasters, with flooding and landslides accounting for nearly two-thirds of these events. The financial haemorrhage is significant; Tajikistan faces estimated average annual losses of 14.5 million USD to transport infrastructure, with 91% of these losses concentrated in the road sector. Looking forward, the vulnerabilities deepen. Under a 4.5-degree warming scenario, nearly a quarter (23%) of road and rail assets would be exposed to more frequent and extreme precipitation.
A truly green road network must also address the "silent crisis" of air quality. In 2022, the transport sector contributed 451 tonnes of PM 2.5 emissions, entirely attributable to road traffic. The economic friction of this pollution is immense; the World Bank estimates that health damages from PM 2.5 exposure cost the country 1.9 billion USD in 2019, equivalent to roughly 6% of GDP.
Despite these challenges, the structural foundations for a transition are visible. The UNEP E-mobility Readiness Index scores Tajikistan at 59 out of 100, indicating a moderate baseline for adopting electric vehicles. Transitioning the fleet—currently composed of 58% light-duty vehicles —to electric traction would leverage the clean grid, immediately decoupling mobility from carbon and tailpipe pollutants.
However, technology alone cannot solve the equity deficit. The current network configuration leaves 2.8 million rural residents—a vast segment of the population—beyond the reach of all-season roads. This isolation severs access to healthcare, education, and markets, reinforcing cycles of poverty. Urban areas fare little better in terms of inclusivity; among eight urban agglomerations, only 20% of residents have access to public transport in the majority of cities. Furthermore, the sector remains heavily gender-imbalanced, with women comprising a mere 9.9% of the total transport workforce.
The imperative for policymakers is to pivot from a focus on simple road expansion to a strategy of "efficient connectivity." Current expansion and maintenance consume an estimated 4.3 million tonnes of material annually, embodying significant carbon emissions. Moreover, road encroachment into ecological sanctuaries is high, with 19 of Tajikistan's 20 Key Biodiversity Areas already containing road infrastructure.
Addressing the rural access gap requires a shift from high-speed corridors to resilient local feeder networks that bring the 2.8 million isolated citizens into the economic fold. A Green Road in Tajikistan is ultimately one that withstands the flood, runs on the river's power, and serves the remote village as reliably as the capital.
Decarbonization
Climate Resilience
Water and Land Management
Reducing Pollution
Preserving Biodiversity
Sustainable Materials Sourcing and Construction Practices
Improving Quality of life
Disaster Preparedness
Fostering Inclusive Growth
Supporting Information
Road Infrastructure Pipeline
| Central Asia Regional Economic Cooperation Corridors 2, 3, and 5 (Obigarm-Nurobod) Road Project | 2019 | 123.6 million USD | None |
| Central Asia Regional Economic Cooperation Corridors 2, 5, and 6 (Dushanbe–Kurgonteppa) Road Project | 2016 | 174.4 million USD | None |
| Dangara-Guliston Road | 2024 | None | None |
| Green Corridor Demonstration Project | 2024 | 86.67 million USD | 49 |
| Preparing the Road Network Sustainability Project | 2020 | 1.23 million USD | None |
| Road Network Sustainability Project | 2020 | 125.4 million USD | None |
| Tajikistan: Dushanbe-Uzbekistan Border Road Improvement | 2016 | None | None |
| Tajikistan: Obigarm-Nurobod Road Project – Long Bridge and Approaches | 2024 | None | None |
Unit Cost Road Projects
Road Transport Policy Landscape
Road Transport Policy Targets
No data
Road Transport Policy Measure Types
References
AIIB. (n.d.). MEASURING TRANSPORT CONNECTIVITY FOR TRADE IN ASIA. https://impact.economist.com/perspectives/sites/default/files/eco141_aiib_transport_connectivity_4.pdf/
Asian Transport Observatory. (2025). Asia and the Pacific's Transport Infrastructure and Investment Outlook 2035. https://asiantransportobservatory.org/analytical-outputs/asia-transport-infrastructure-investment-needs/
Barrington-Leigh, C., & Millard-Ball, A. (2025). A high-resolution global time series of street-network sprawl. https://journals.sagepub.com/doi/10.1177/23998083241306829
CDRI. (2023). Global Infrastructure Risk Model and Resilience Index. https://giri.unepgrid.ch/
CIESIN. (2023a). Rural Access Index [Dataset]. https://sedac.ciesin.columbia.edu/data/set/sdgi-9-1-1-rai-2023
CIESIN. (2023b). SDG Indicator 11.2.1: Urban Access to Public Transport, 2023 Release: Sustainable Development Goal Indicators (SDGI). https://sedac.ciesin.columbia.edu/data/set/sdgi-11-2-1-urban-access-public-transport-2023
EDGAR. (2025). GHG emissions of all world countries: 2025. Publications Office. https://data.europa.eu/doi/10.2760/9816914
Ember. (2024). Electricity Data Explorer [Dataset]. https://ember-energy.org/data/electricity-data-explorer
EM-DAT. (2025). EM-DAT - The international disaster database. https://www.emdat.be/European Commission. (2024). Global Air Pollutant Emissions EDGAR v8.1 [Dataset]. https://edgar.jrc.ec.europa.eu/dataset_ap61#sources
IEA. (n.d.). Fossil Fuel Subsidies. IEA. Retrieved April 19, 2025, from https://www.iea.org/topics/fossil-fuel-subsidies
ILO. (2025). ILOSTAT [Dataset]. https://rplumber.ilo.org/files/website/bulk/indicator.html
ITDP. (2024). The Atlas of Sustainable City Transport. https://atlas.itdp.org/
Koks, E., Rozenberg, J., Tariverdi, M., Dickens, B., Fox, C., Ginkel, K. van, & Hallegatte, S. (2023). A global assessment of national road network vulnerability. Environmental Research: Infrastructure and Sustainability, 3(2), 025008. https://doi.org/10.1088/2634-4505/acd1aa
Liu, K., Wang, Q., Wang, M., & Koks, E. E. (2023). Global transportation infrastructure exposure to the change of precipitation in a warmer world. Nature Communications, 14(1), 2541. https://doi.org/10.1038/s41467-023-38203-3
McDuffie, E. E., Martin, R. V., Spadaro, J. V., Burnett, R., Smith, S. J., O'Rourke, P., Hammer, M. S., van Donkelaar, A., Bindle, L., Shah, V., Jaeglé, L., Luo, G., Yu, F., Adeniran, J. A., Lin, J., & Brauer, M. (2021). Source sector and fuel contributions to ambient PM2.5 and attributable mortality across multiple spatial scales. Nature Communications, 12(1), 3594. https://doi.org/10.1038/s41467-021-23853-y
Parry, S. B., Antung A. Liu,Ian W. H. (2023). IMF Fossil Fuel Subsidies Data: 2023 Update. IMF. https://www.imf.org/en/publications/wp/issues/2023/08/22/imf-fossil-fuel-subsidies-data-2023-update-537281
Simkins, A. T., Beresford, A. E., Buchanan, G. M., Crowe, O., Elliott, W., Izquierdo, P., Patterson, D. J., & Butchart, S. H. M. (2023). A global assessment of the prevalence of current and potential future infrastructure in Key Biodiversity Areas. Biological Conservation, 281, 109953. https://doi.org/10.1016/j.biocon.2023.109953
Sims, M., Stanimirova, R., Neumann, M., Raichuk, A., & Purves, D. (2025). New Data Shows What's Driving Forest Loss Around the World. https://www.wri.org/insights/forest-loss-drivers-data-trends
Trademap. (2025). Trade Map. Trade Map. https://www.trademap.org/Index.aspx
UN DESA. (n.d.). Economic and Environmental Vulnerability Indicators. Retrieved January 26, 2026, from https://policy.desa.un.org/themes/least-developed-countries-category/ldc-identification-criteria-indicators/evi-indicators
UN DESA. (2025). 2024 Revision of World Population Prospects. https://population.un.org/wpp/
UN Energy Statistics. (2025). Energy Balance Visualization [Dataset]. https://unstats.un.org/unsd/energystats/dataPortal/
UNEP. (2021, May 12). Domestic material consumption (DMC) and DMC per capita, per GDP (Tier I). https://www.unep.org/indicator-1222
Weiss, D. J., Nelson, A., Gibson, H. S., Temperley, W., Peedell, S., Lieber, A., Hancher, M., Poyart, E., Belchior, S., Fullman, N., Mappin, B., Dalrymple, U., Rozier, J., Lucas, T. C. D., Howes, R. E., Tusting, L. S., Kang, S. Y., Cameron, E., Bisanzio, D., … Gething, P. W. (2018). A global map of travel time to cities to assess inequalities in accessibility in 2015. Nature, 553(7688), 333-336. https://doi.org/10.1038/nature25181
WHO. (2023). Global Status Report on Road Safety 2023. https://www.who.int/teams/social-determinants-of-health/safety-and-mobility/global-status-report-on-road-safety-2023
Wiedenhofer, D., Baumgart, A., Matej, S., Virág, D., Kalt, G., Lanau, M., Tingley, D. D., Liu, Z., Guo, J., Tanikawa, H., & Haberl, H. (2024). Mapping and modelling global mobility infrastructure stocks, material flows and their embodied greenhouse gas emissions [Dataset]. https://doi.org/10.1016/j.jclepro.2023.139742
World Bank. (2021). ICP 2021. https://databank.worldbank.org/source/icp-2021
World Bank. (2022a). Annual freshwater withdrawals, total (% of internal resources) [Dataset]. https://data.worldbank.org
World Bank. (2022b). Land area (sq. Km) [Dataset]. https://data.worldbank.org
World Bank. (2022c). The Global Health Cost of PM2.5 Air Pollution: A Case for Action Beyond 2021. The World Bank. https://doi.org/10.1596/978-1-4648-1816-5
World Bank. (2023). Forest area (% of land area) [Dataset]. https://data.worldbank.org/indicator/AG.LND.FRST.ZS
World Bank. (2024). Home | Logistics Performance Index (LPI). Logistics Performance Index. https://lpi.worldbank.org/
World Bank. (2025a). GDP per capita, PPP (current international $) [Dataset]. https://data.worldbank.org/indicator/NY.GDP.PCAP.PP.CD
World Bank. (2025b). GDP, PPP (current international $) [Dataset]. https://data.worldbank.org/indicator/NY.GDP.MKTP.PP.CD
World Database on Protected Areas. (2024). Protected Areas (WDPA) [Dataset]. https://www.protectedplanet.net/en/thematic-areas/wdpa?tab=WDPA