
Sri Lanka Green Roads Profile 2025
SRI LANKA
GREEN ROADS PROFILESupported by:
The ATO green roads profiles present country-level perspectives on how 35 Asia-Pacific economies are addressing the development and management of sustainable eco-friendly roads. Drawing from diverse datasets and policy documents, the profiles highlight practices and measures that contribute to greener transport infrastructure.
Developed by the Asian Transport Observatory (ATO) in partnership with the International Road Federation (IRF), the profiles are designed to complement the Green Roads Toolkit. The toolkit provides a practical reference for integrating good practices across nine dimensions:
- Decarbonization
- Climate resilience
- Water and land management
- Pollution reduction
- Conserving biodiversity
- Responsible sourcing of materials
- Improving quality of life
- Disaster preparedness
- Fostering inclusive growth
This 2025 edition builds on earlier work to provide a comprehensive resource for guiding the planning, development, construction, and management of greener, more sustainable roads.
Background
Indicator - Dimension Matrix

The Connectivity Paradox Sri Lanka possesses a terrestrial connectivity footprint that is nothing short of remarkable. With a road density of 1,670 meters per square kilometer in 2024, the island's infrastructure penetration is exceptional for its size, weaving a 103,300-kilometer web that links 89% of its network to local and rural communities. While the sheer scale of the network drives the economy, it also locks the country into a high-carbon, high-risk trajectory that threatens both fiscal stability and environmental integrity.
The current system is heavily motorized—345 vehicles per thousand population, surpassing the Asia-Pacific average of 317—but it is surprisingly inefficient. The fleet is dominated by two-wheelers (53%) and three-wheelers (17%), creating a chaotic mix of traffic that serves as the primary engine for the country's 10.4 million tonnes of road transport GHG emissions. These emissions now account for a 98% of the total transport sector's carbon output and 28% of economy-wide emissions. While emissions intensity per unit of GDP has improved by 1.8% annually since 2015, this pace lags significantly behind the South Asian average of 5.5%, signaling a structural stagnation in decarbonization efforts.
The physical resilience of Sri Lanka's transport backbone is brittle. In a 4.5-degree warming scenario, over 63% of road and rail assets would be exposed to frequent and extreme precipitation. The financial implications are already visible: the country faces average annual losses of $24.1 million to transport infrastructure, with roads absorbing 52% of this damage. Bridges and tunnels are disproportionate choke points, incurring 2.6% of losses despite comprising just 0.2% of the infrastructure stock.
This vulnerability is compounded by the "hidden" subsidies that distort the market. While direct fossil fuel subsidies for transport have fallen from $1.1 billion (2010-2015) to $794 million (2016-2023), the external costs society pays are colossal. Road crashes alone account for 88% of these external costs, a grim statistic reinforced by the loss of 2,513 lives in 2021. The World Bank estimates the annual cost of health damages from PM2.5 exposure—of which road transport is a significant contributor—at $24 billion, or roughly 8% of GDP.
Sri Lanka sits on a material stock of 465.6 million tonnes of road infrastructure, a massive sunk cost in carbon and minerals. Maintaining and expanding this requires an additional 9.8 million tonnes of material annually, embodying 403,000 tonnes of CO2 equivalent before a single vehicle drives on the surface.
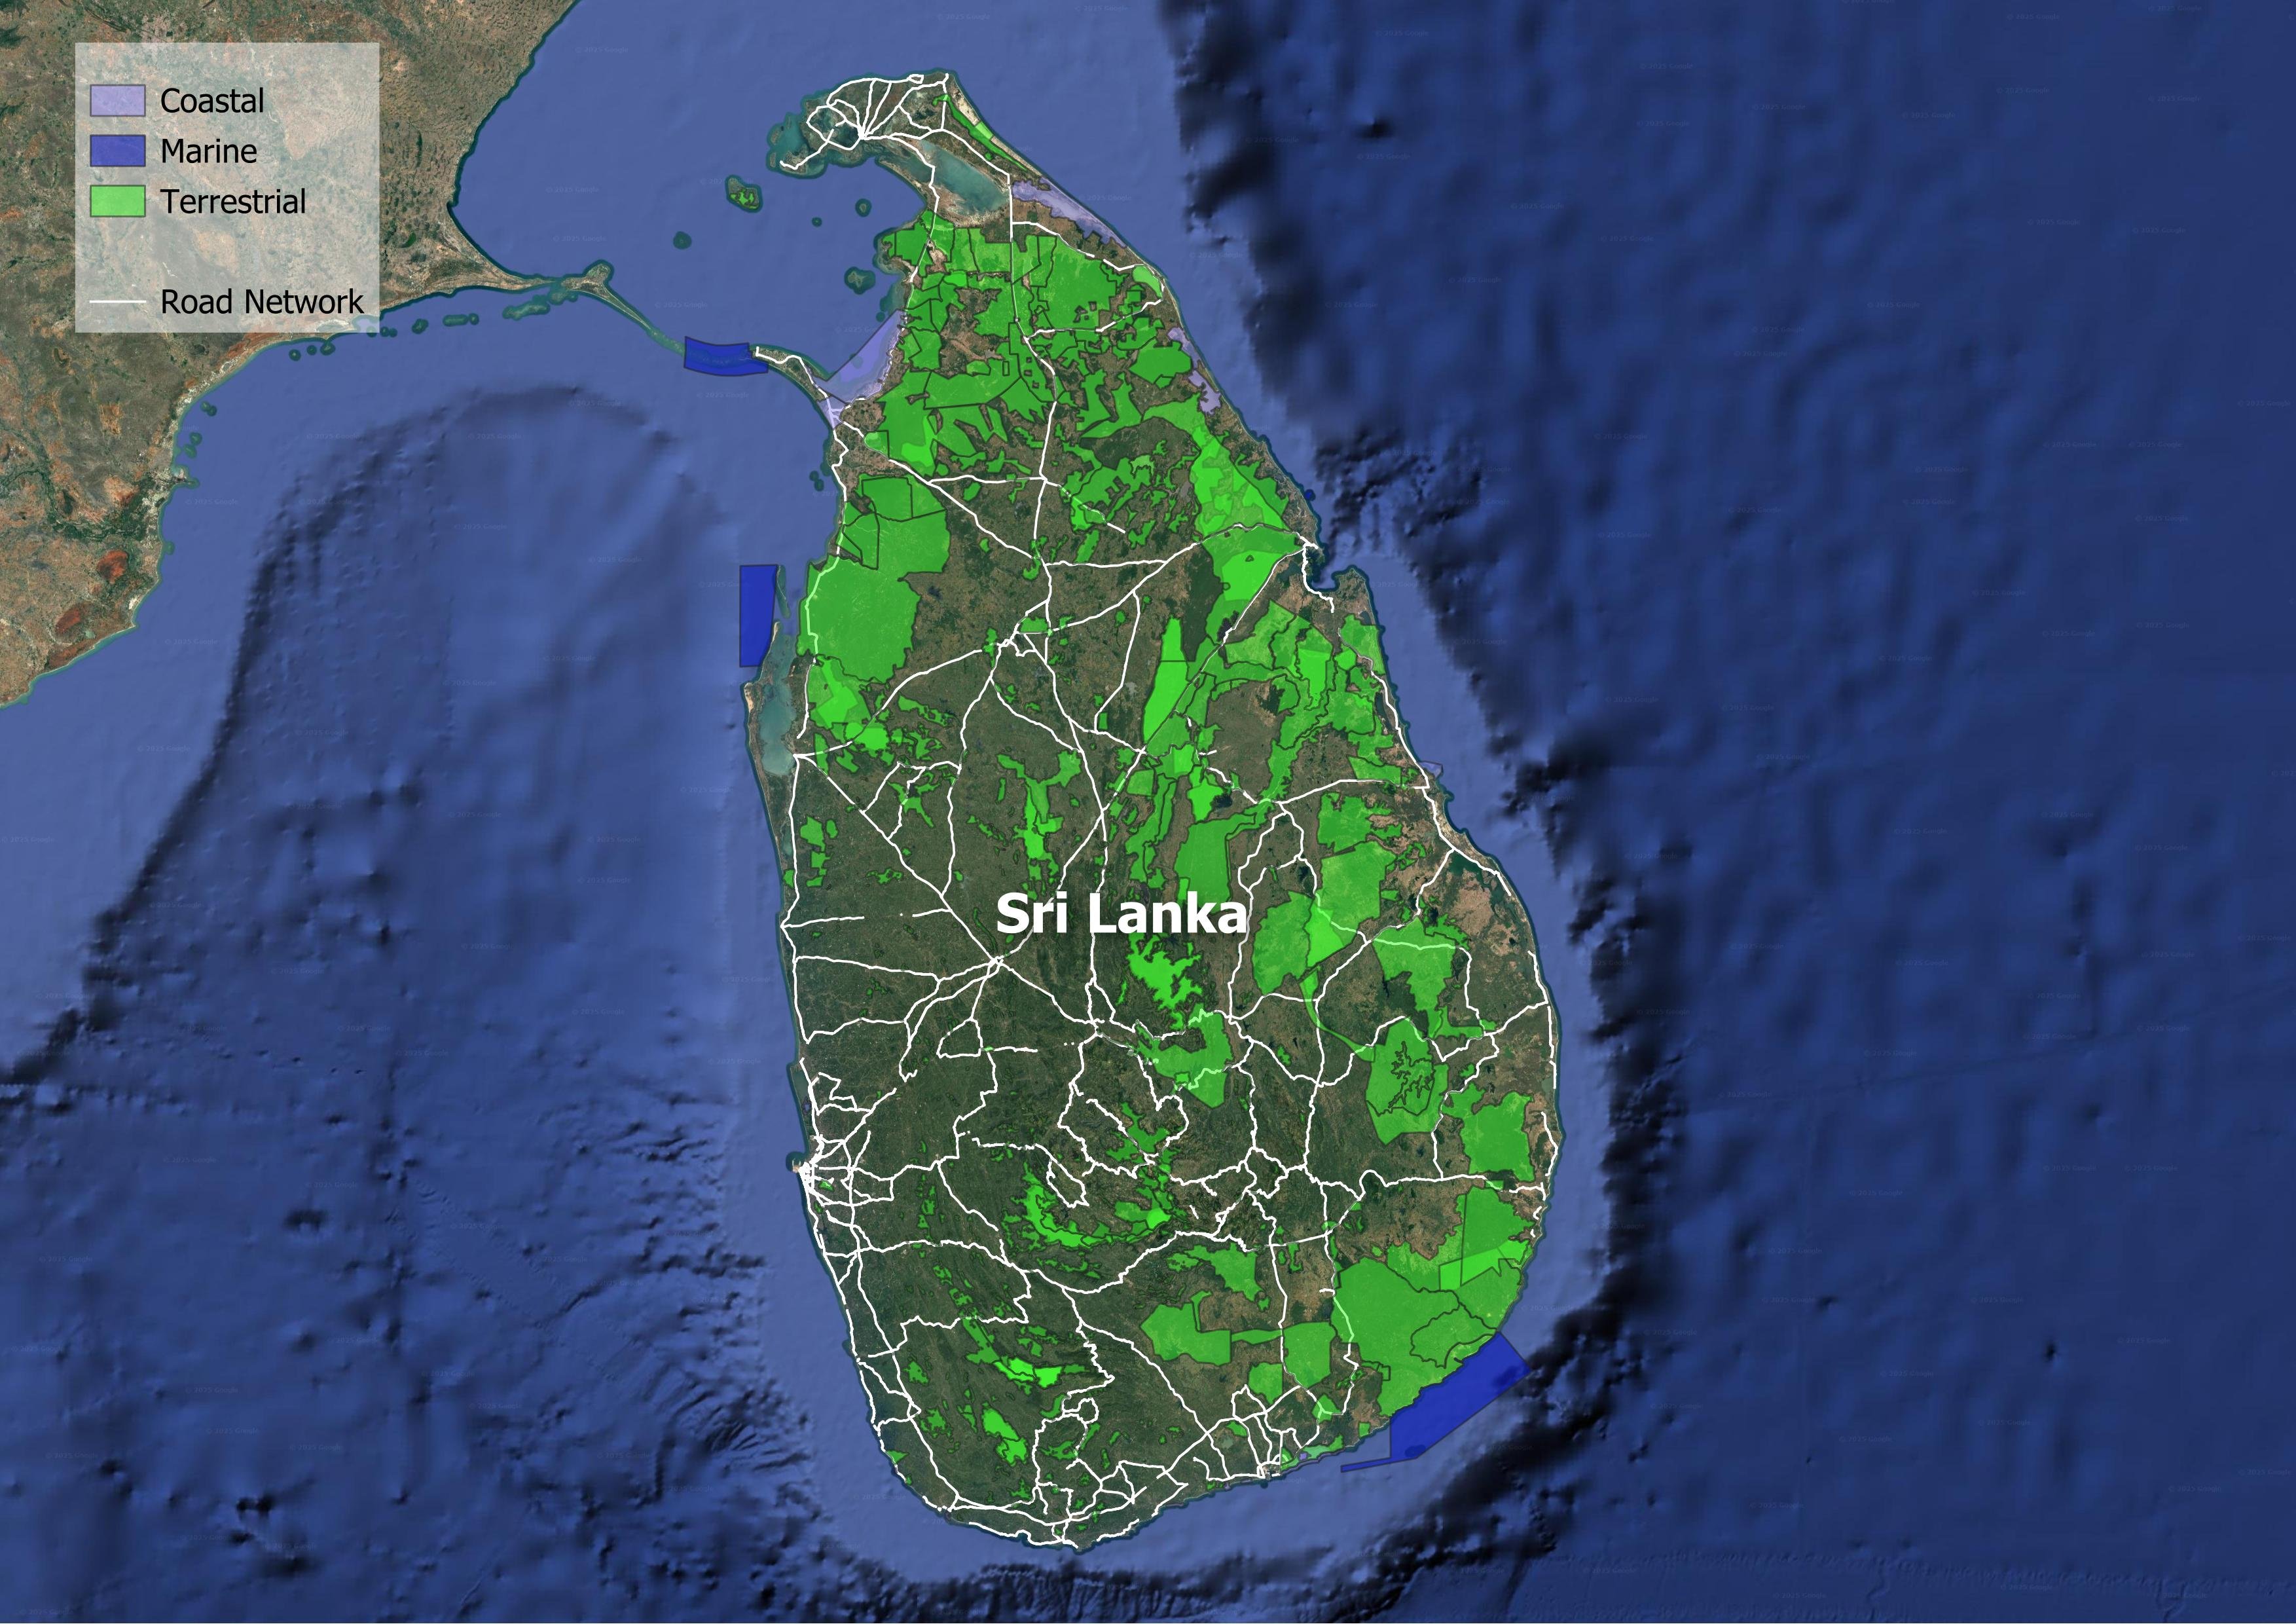
Furthermore, the current network alignment is in direct conflict with the island's ecological wealth. Research indicates that 51 of Sri Lanka's 70 Key Biodiversity Areas (KBAs) have road infrastructure cutting through them. This intrusion density—169 meters of road per thousand square kilometers of KBA—is nearly double the South Asian average. Recent UNEP mapping suggests that just four specific road projects, totaling 74 kilometers, threaten over 145,000 tonnes of carbon stock and critical nitrogen retention systems.
Despite the high road density, 430,000 rural residents remain cut off from all-season roads, leaving them isolated from healthcare, education, and markets. Conversely, in urban areas, access does not equate to mobility. In 63% of Sri Lanka's cities, only two out of ten residents have convenient access to public transport, and only 6% of urban agglomerations offer transit access to half their population. The result is a forced reliance on private vehicles that drains household budgets—transport costs consumed 21.1% of household expenditure in 2021.
The uptake of electric vehicles (EVs) is accelerating, with EVs representing 46% of total road vehicle imports by value in 2024. Yet, the composition of these imports—71% light-duty vehicles and only 2% buses—suggests a transition focused on the wealthy rather than the masses. Sri Lanka scores a decent 64/100 on UNEP's E-mobility Readiness Index, but the lag in policy (score 15) and finance (score 15) threatens to stall momentum.
The path forward requires a systemic shift from expansion to modernization. The infrastructure is already there; the challenge now is to make it work for the future.
Decarbonization
Climate Resilience
Water and Land Management
Reducing Pollution
Preserving Biodiversity
Sustainable Materials Sourcing and Construction Practices
Improving Quality of life
Disaster Preparedness
Fostering Inclusive Growth
Supporting Information
Road Infrastructure Pipeline
No data
Unit Cost Road Projects
Road Transport Policy Landscape
Road Transport Policy Targets
No data
Road Transport Policy Measure Types
References
AIIB. (n.d.). MEASURING TRANSPORT CONNECTIVITY FOR TRADE IN ASIA. https://impact.economist.com/perspectives/sites/default/files/eco141_aiib_transport_connectivity_4.pdf/
Asian Transport Observatory. (2025). Asia and the Pacific's Transport Infrastructure and Investment Outlook 2035. https://asiantransportobservatory.org/analytical-outputs/asia-transport-infrastructure-investment-needs/
Barrington-Leigh, C., & Millard-Ball, A. (2025). A high-resolution global time series of street-network sprawl. https://journals.sagepub.com/doi/10.1177/23998083241306829
CDRI. (2023). Global Infrastructure Risk Model and Resilience Index. https://giri.unepgrid.ch/
CIESIN. (2023a). Rural Access Index [Dataset]. https://sedac.ciesin.columbia.edu/data/set/sdgi-9-1-1-rai-2023
CIESIN. (2023b). SDG Indicator 11.2.1: Urban Access to Public Transport, 2023 Release: Sustainable Development Goal Indicators (SDGI). https://sedac.ciesin.columbia.edu/data/set/sdgi-11-2-1-urban-access-public-transport-2023
EDGAR. (2025). GHG emissions of all world countries: 2025. Publications Office. https://data.europa.eu/doi/10.2760/9816914
Ember. (2024). Electricity Data Explorer [Dataset]. https://ember-energy.org/data/electricity-data-explorer
EM-DAT. (2025). EM-DAT - The international disaster database. https://www.emdat.be/European Commission. (2024). Global Air Pollutant Emissions EDGAR v8.1 [Dataset]. https://edgar.jrc.ec.europa.eu/dataset_ap61#sources
IEA. (n.d.). Fossil Fuel Subsidies. IEA. Retrieved April 19, 2025, from https://www.iea.org/topics/fossil-fuel-subsidies
ILO. (2025). ILOSTAT [Dataset]. https://rplumber.ilo.org/files/website/bulk/indicator.html
ITDP. (2024). The Atlas of Sustainable City Transport. https://atlas.itdp.org/
Koks, E., Rozenberg, J., Tariverdi, M., Dickens, B., Fox, C., Ginkel, K. van, & Hallegatte, S. (2023). A global assessment of national road network vulnerability. Environmental Research: Infrastructure and Sustainability, 3(2), 025008. https://doi.org/10.1088/2634-4505/acd1aa
Liu, K., Wang, Q., Wang, M., & Koks, E. E. (2023). Global transportation infrastructure exposure to the change of precipitation in a warmer world. Nature Communications, 14(1), 2541. https://doi.org/10.1038/s41467-023-38203-3
McDuffie, E. E., Martin, R. V., Spadaro, J. V., Burnett, R., Smith, S. J., O'Rourke, P., Hammer, M. S., van Donkelaar, A., Bindle, L., Shah, V., Jaeglé, L., Luo, G., Yu, F., Adeniran, J. A., Lin, J., & Brauer, M. (2021). Source sector and fuel contributions to ambient PM2.5 and attributable mortality across multiple spatial scales. Nature Communications, 12(1), 3594. https://doi.org/10.1038/s41467-021-23853-y
Parry, S. B., Antung A. Liu,Ian W. H. (2023). IMF Fossil Fuel Subsidies Data: 2023 Update. IMF. https://www.imf.org/en/publications/wp/issues/2023/08/22/imf-fossil-fuel-subsidies-data-2023-update-537281
Simkins, A. T., Beresford, A. E., Buchanan, G. M., Crowe, O., Elliott, W., Izquierdo, P., Patterson, D. J., & Butchart, S. H. M. (2023). A global assessment of the prevalence of current and potential future infrastructure in Key Biodiversity Areas. Biological Conservation, 281, 109953. https://doi.org/10.1016/j.biocon.2023.109953
Sims, M., Stanimirova, R., Neumann, M., Raichuk, A., & Purves, D. (2025). New Data Shows What's Driving Forest Loss Around the World. https://www.wri.org/insights/forest-loss-drivers-data-trends
Trademap. (2025). Trade Map. Trade Map. https://www.trademap.org/Index.aspx
UN DESA. (n.d.). Economic and Environmental Vulnerability Indicators. Retrieved January 26, 2026, from https://policy.desa.un.org/themes/least-developed-countries-category/ldc-identification-criteria-indicators/evi-indicators
UN DESA. (2025). 2024 Revision of World Population Prospects. https://population.un.org/wpp/
UN Energy Statistics. (2025). Energy Balance Visualization [Dataset]. https://unstats.un.org/unsd/energystats/dataPortal/
UNEP. (2021, May 12). Domestic material consumption (DMC) and DMC per capita, per GDP (Tier I). https://www.unep.org/indicator-1222
Weiss, D. J., Nelson, A., Gibson, H. S., Temperley, W., Peedell, S., Lieber, A., Hancher, M., Poyart, E., Belchior, S., Fullman, N., Mappin, B., Dalrymple, U., Rozier, J., Lucas, T. C. D., Howes, R. E., Tusting, L. S., Kang, S. Y., Cameron, E., Bisanzio, D., … Gething, P. W. (2018). A global map of travel time to cities to assess inequalities in accessibility in 2015. Nature, 553(7688), 333-336. https://doi.org/10.1038/nature25181
WHO. (2023). Global Status Report on Road Safety 2023. https://www.who.int/teams/social-determinants-of-health/safety-and-mobility/global-status-report-on-road-safety-2023
Wiedenhofer, D., Baumgart, A., Matej, S., Virág, D., Kalt, G., Lanau, M., Tingley, D. D., Liu, Z., Guo, J., Tanikawa, H., & Haberl, H. (2024). Mapping and modelling global mobility infrastructure stocks, material flows and their embodied greenhouse gas emissions [Dataset]. https://doi.org/10.1016/j.jclepro.2023.139742
World Bank. (2021). ICP 2021. https://databank.worldbank.org/source/icp-2021
World Bank. (2022a). Annual freshwater withdrawals, total (% of internal resources) [Dataset]. https://data.worldbank.org
World Bank. (2022b). Land area (sq. Km) [Dataset]. https://data.worldbank.org
World Bank. (2022c). The Global Health Cost of PM2.5 Air Pollution: A Case for Action Beyond 2021. The World Bank. https://doi.org/10.1596/978-1-4648-1816-5
World Bank. (2023). Forest area (% of land area) [Dataset]. https://data.worldbank.org/indicator/AG.LND.FRST.ZS
World Bank. (2024). Home | Logistics Performance Index (LPI). Logistics Performance Index. https://lpi.worldbank.org/
World Bank. (2025a). GDP per capita, PPP (current international $) [Dataset]. https://data.worldbank.org/indicator/NY.GDP.PCAP.PP.CD
World Bank. (2025b). GDP, PPP (current international $) [Dataset]. https://data.worldbank.org/indicator/NY.GDP.MKTP.PP.CD
World Database on Protected Areas. (2024). Protected Areas (WDPA) [Dataset]. https://www.protectedplanet.net/en/thematic-areas/wdpa?tab=WDPA