
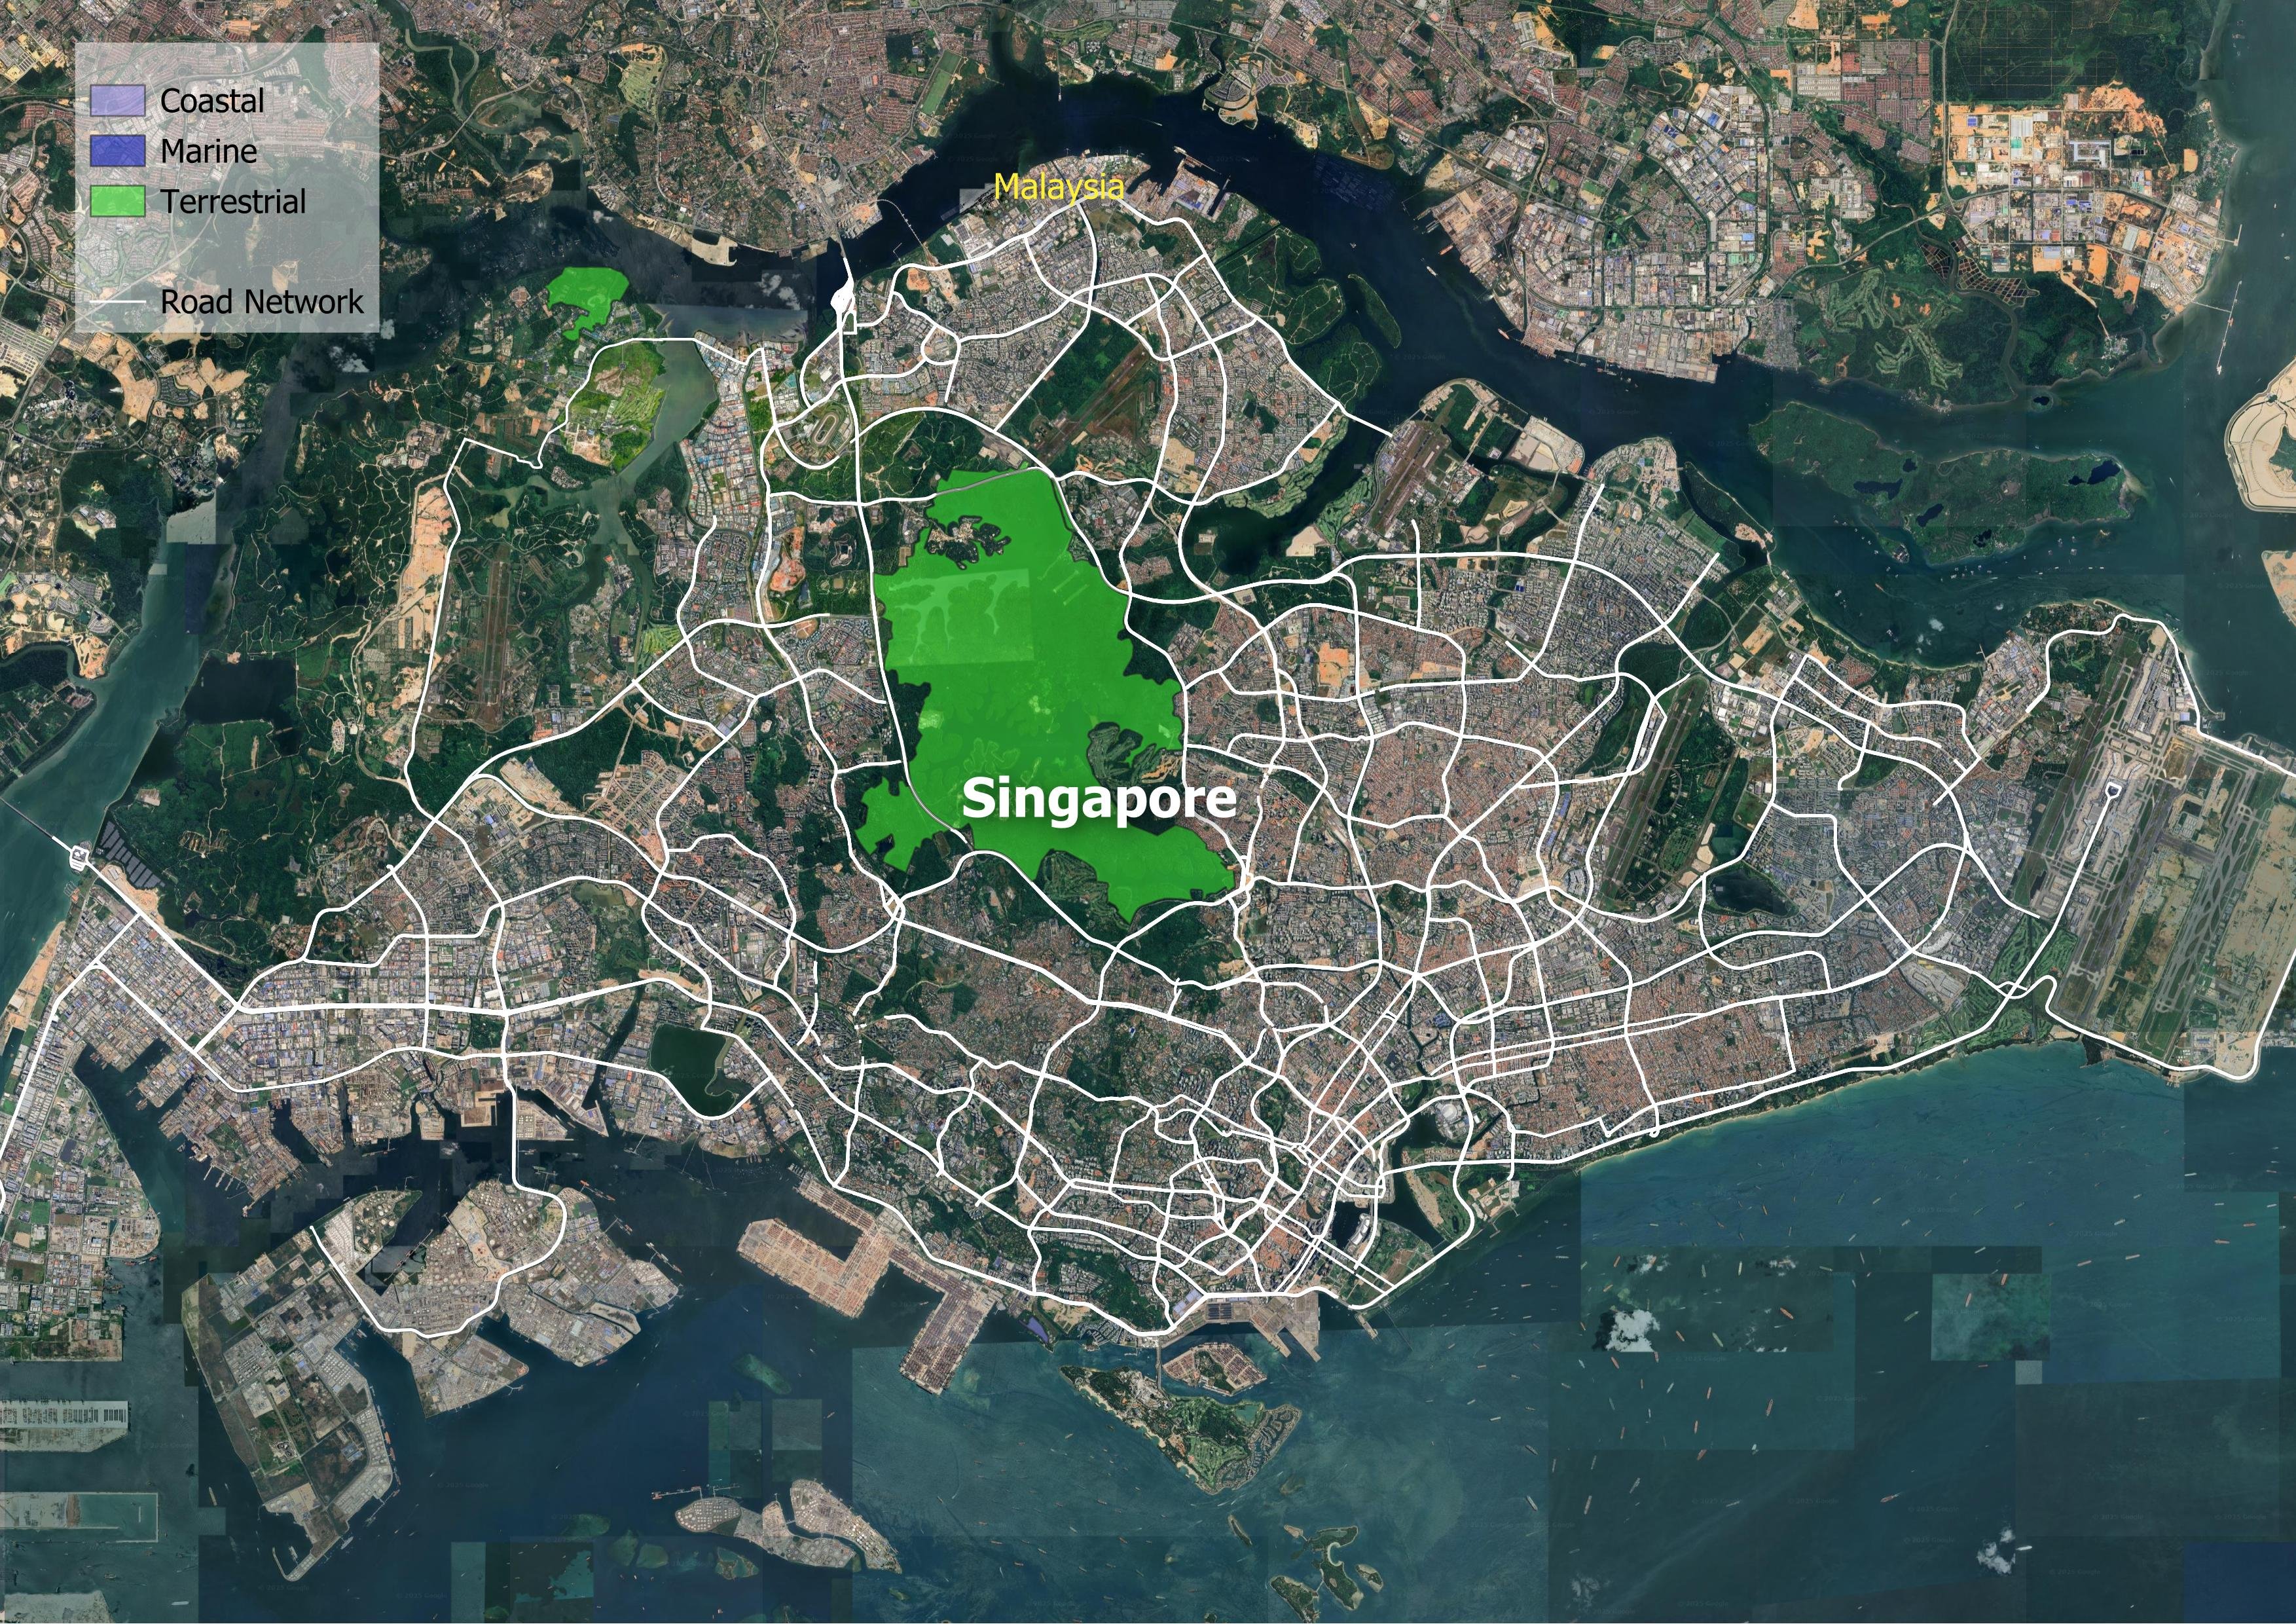
Singapore Green Roads Profile 2025
SINGAPORE
GREEN ROADS PROFILESupported by:
The ATO green roads profiles present country-level perspectives on how 35 Asia-Pacific economies are addressing the development and management of sustainable eco-friendly roads. Drawing from diverse datasets and policy documents, the profiles highlight practices and measures that contribute to greener transport infrastructure.
Developed by the Asian Transport Observatory (ATO) in partnership with the International Road Federation (IRF), the profiles are designed to complement the Green Roads Toolkit. The toolkit provides a practical reference for integrating good practices across nine dimensions:
- Decarbonization
- Climate resilience
- Water and land management
- Pollution reduction
- Conserving biodiversity
- Responsible sourcing of materials
- Improving quality of life
- Disaster preparedness
- Fostering inclusive growth
This 2025 edition builds on earlier work to provide a comprehensive resource for guiding the planning, development, construction, and management of greener, more sustainable roads.
Background
Indicator - Dimension Matrix

Singapore showcases a unique paradox in Asian transport policy: it is a highly dense economic hub where high income levels haven't led to excessive motorization. With a GDP per capita of $155,972 and a population of 5.8 million within about 718 square kilometers, this city-state acts as a living laboratory for balancing accessibility, emissions, and infrastructure resilience. The concept of "Green Roads" extends beyond basic asphalt work to a comprehensive system managing fleet, fuel, and flow.
Unlike many high-income peers where vehicle ownership signals status, Singapore has aggressively managed demand. Motorization stands at 169 vehicles per thousand population, a stark contrast to the Asia-Pacific average of 317, despite the island's immense wealth. This restraint is policy-driven, ensuring that while the road network remains dense—at 13,385 meters per square kilometer —it does not succumb to gridlock.
However, the existing fleet still carries a carbon burden. Road transport generated 6.0 million tonnes of CO2-equivalent (CO2e) in 2024, accounting for 94% of total transport emissions. The trajectory, however, is bending. Since 2015, the emissions intensity of the sector relative to GDP has improved by 8.6% annually, outpacing the Asia-Pacific average improvement of 5.4%.
Deep decarbonization now relies on the rapid electrification of the vehicle stock. The market signals are clear: electric vehicles (EVs) constituted 34% of total road vehicle imports by value over the 2015–2024 period, with the import value reaching $3.1 billion. The readiness for this transition is high—UNEP scores Singapore 81 out of 100 on E-mobility Readiness —yet the environmental integrity of this shift depends on the grid. With a grid emission factor of 499 gCO2 per kWh, Singapore is cleaner than the regional average but has seen only marginal improvement (0.2%) since 2015.
As the climate shifts, the physical vulnerability of Singapore's highly engineered infrastructure stock becomes a critical fiscal liability. The country faces estimated average annual losses of $49.6 million related to transport infrastructure, with road assets accounting for 65% of this figure. Bridges and tunnels appear disproportionately fragile, bearing nearly 48% of road-related losses despite constituting only 2.5% of the infrastructure.
The projected risks are non-linear. In a 4.5-degree warming scenario, more than 100% of the road and rail assets are flagged as exposed to frequent and extreme precipitation. This necessitates a shift in asset management from responsive maintenance to predictive hardening, particularly given that an estimated 2.1 million tonnes of material is already consumed annually for expansion and maintenance, carrying an embodied carbon price tag of 177,000 tonnes of CO2-equivalent.
The "Green Road" concept must also account for the immediate biological environment. Singapore has achieved significant wins in air quality; PM 2.5 emissions from road transport have declined by 6.8% per year since 2015. Yet, the proximity of infrastructure to habitation remains a challenge in such a dense environment. Only 19% of the urban population lives more than 500 meters away from highways, exposing the vast majority to residual noise and tailpipe pollutants.
Safety remains the other half of the health equation. Road crashes impose a substantial economic burden on Singapore. In 2021, the estimated cost of fatalities and serious injuries reached approximately 4 billion USD, equivalent to roughly 1% of Singapore's GDP. In Singapore, road crash fatalities decreased by approximately -5.4% per year between 2016 and 2021. However, this is not enough to reach the 2030 target to halve the fatalities by 2030.
Singapore's transport story is one of high efficiency achieved through deliberate constraint. The data indicates a system that delivers exceptional access—100% of citizens have high public transport accessibility —while maintaining a lower carbon footprint per dollar of GDP than its neighbors. The challenge for the coming decade lies less in climate resilience and accelerating the decarbonization of the energy grid that powers its growing electric fleet. Success here will define the template for high-density tropical urbanism in the 21st century.
Decarbonization
Climate Resilience
Water and Land Management
Reducing Pollution
Preserving Biodiversity
Sustainable Materials Sourcing and Construction Practices
Improving Quality of life
Disaster Preparedness
Fostering Inclusive Growth
Supporting Information
Road Infrastructure Pipeline
No data
Unit Cost Road Projects
Road Transport Policy Landscape
Road Transport Policy Targets
| Climate Action Plan | 2030 | To facilitate walking and cycling, our sheltered walkway network will be quadrupled from the existing 56km to 200km by 2018. Cycling paths will double from 355km in 2015 to more than 700km by 2030. |
| Land Transport Master Plan 2040 | 2040 | Looking ahead, we will continue to expand the cycling path network to more than 1,000km by 2040 |
| Singapore's Long-Term Low-Emissions Development Strategy | 2040 | A further 150km of these covered linkways will be added by 2040. By 2040, our cycling path network will be extended to more than 1,000km from 440km in 2019. |
| SINGAPORE’S SECOND NATIONALLY DETERMINED CONTRIBUTION (NDC) | 2030 | Our cycling path network will be extended from over 600 km today to around 1,300 km by 2030 |
| Singapore's Fifth National Communication and Fifth Biennial Update Report | 2030 | Singapore will accelerate the building of cycling paths and active mobility infrastructure to make cycling and walking more convenient and attractive. By 2030, our cycling path network will be extended to more than 1,000 km, up from 460 km in 2020. |
| Singapore's Fifth National Communication and Fifth Biennial Update Report | 2040 | Beyond the 200 km of sheltered walkways from transport nodes to homes and public amenities built as of now, a further 150 km of these sheltered walkways will be added by 2040. |
| Sustainable Singapore Blueprint 2015 | 2030 | Over 700 km of cycling paths, together with enhanced cycling infrastructure and code of conduct for safer cycling More than 200 km of sheltered walkways to transport nodes |
| Voluntary National Reviews 2023 - SGP | 2030 | We continue to promote active mobility, and are expanding our cycling network to around 1,300km by 2030. |
| Land Transport Master Plan 2040 | 2026 | We will also give seniors and persons with disabilities more time to cross the road. We have introduced the Green Man Plus scheme at about 1,000 pedestrian crossings and will extend this to another 1,500 pedestrian crossings in housing estates by 2026 |
| Land Transport Master Plan 2040 | 2040 | However, we should and will do more to improve barrier-free accessibility, so that more journeys by walking, cycling and riding public transport are barrier-free by 2040. |
| Land Transport Master Plan 2040 | 2040 | We want a Singapore that is a 45-Minute City with 20-Minute Towns in 2040 All journeys to the nearest neighbourhood centre using Walk-Cycle-Ride modes of transport will take less than 20 minutes. We will aim for 9 in 10 peak-period journeys using Walk-Cycle-Ride to be completed in less than 45 minutes. We will expand our rail network, improve bus speeds and bring jobs closer to homes. These will save the average commuter about 15 minutes every weekday. To facilitate a comfortable walking environment, we will add 150km of covered linkways between MRT stations, residential areas and amenities by 2040. |
| Singapore Green Plan | 2030 | We are making good progress towards achieving our goal of bringing 8 in 10 households within a 10-minute walk of a train station by the 2030s |
| SINGAPORE’S SECOND NATIONALLY DETERMINED CONTRIBUTION (NDC) | 2040 | Our aim is for all journeys to the nearest neighbourhood centre using 15 WCR modes of transport to take no more than 20 minutes, and 9 in 10 peak period WCR journeys to be completed in less than 45 minutes, by 2040. |
| Singapore's Fifth National Communication and Fifth Biennial Update Report | 2040 | By 2040, all journeys to the nearest neighbourhood centre using WCR modes of transport will take no more than 20 minutes, while nine in 10 peak period WCR journeys will be completed in less than 45 minutes. |
| Sustainable Singapore Blueprint 2015 | 2030 | 8 in 10 households within 10-min walk of a train station 9 in 10 homes to be within 10-min walk of a park Electric Line Ratio (%) = 72 (48 - 2022) |
| Voluntary National Reviews 2023 - SGP | 2040 | This will bring us towards our aim of increasing peak-period public transport journeys completed by Walk-Cycle-Ride modes under 45 minutes from 70% today to 90% by 2040. |
Road Transport Policy Measure Types
References
AIIB. (n.d.). MEASURING TRANSPORT CONNECTIVITY FOR TRADE IN ASIA. https://impact.economist.com/perspectives/sites/default/files/eco141_aiib_transport_connectivity_4.pdf/
Asian Transport Observatory. (2025). Asia and the Pacific's Transport Infrastructure and Investment Outlook 2035. https://asiantransportobservatory.org/analytical-outputs/asia-transport-infrastructure-investment-needs/
Barrington-Leigh, C., & Millard-Ball, A. (2025). A high-resolution global time series of street-network sprawl. https://journals.sagepub.com/doi/10.1177/23998083241306829
CDRI. (2023). Global Infrastructure Risk Model and Resilience Index. https://giri.unepgrid.ch/
CIESIN. (2023a). Rural Access Index [Dataset]. https://sedac.ciesin.columbia.edu/data/set/sdgi-9-1-1-rai-2023
CIESIN. (2023b). SDG Indicator 11.2.1: Urban Access to Public Transport, 2023 Release: Sustainable Development Goal Indicators (SDGI). https://sedac.ciesin.columbia.edu/data/set/sdgi-11-2-1-urban-access-public-transport-2023
EDGAR. (2025). GHG emissions of all world countries: 2025. Publications Office. https://data.europa.eu/doi/10.2760/9816914
Ember. (2024). Electricity Data Explorer [Dataset]. https://ember-energy.org/data/electricity-data-explorer
EM-DAT. (2025). EM-DAT - The international disaster database. https://www.emdat.be/European Commission. (2024). Global Air Pollutant Emissions EDGAR v8.1 [Dataset]. https://edgar.jrc.ec.europa.eu/dataset_ap61#sources
IEA. (n.d.). Fossil Fuel Subsidies. IEA. Retrieved April 19, 2025, from https://www.iea.org/topics/fossil-fuel-subsidies
ILO. (2025). ILOSTAT [Dataset]. https://rplumber.ilo.org/files/website/bulk/indicator.html
ITDP. (2024). The Atlas of Sustainable City Transport. https://atlas.itdp.org/
Koks, E., Rozenberg, J., Tariverdi, M., Dickens, B., Fox, C., Ginkel, K. van, & Hallegatte, S. (2023). A global assessment of national road network vulnerability. Environmental Research: Infrastructure and Sustainability, 3(2), 025008. https://doi.org/10.1088/2634-4505/acd1aa
Liu, K., Wang, Q., Wang, M., & Koks, E. E. (2023). Global transportation infrastructure exposure to the change of precipitation in a warmer world. Nature Communications, 14(1), 2541. https://doi.org/10.1038/s41467-023-38203-3
McDuffie, E. E., Martin, R. V., Spadaro, J. V., Burnett, R., Smith, S. J., O'Rourke, P., Hammer, M. S., van Donkelaar, A., Bindle, L., Shah, V., Jaeglé, L., Luo, G., Yu, F., Adeniran, J. A., Lin, J., & Brauer, M. (2021). Source sector and fuel contributions to ambient PM2.5 and attributable mortality across multiple spatial scales. Nature Communications, 12(1), 3594. https://doi.org/10.1038/s41467-021-23853-y
Parry, S. B., Antung A. Liu,Ian W. H. (2023). IMF Fossil Fuel Subsidies Data: 2023 Update. IMF. https://www.imf.org/en/publications/wp/issues/2023/08/22/imf-fossil-fuel-subsidies-data-2023-update-537281
Simkins, A. T., Beresford, A. E., Buchanan, G. M., Crowe, O., Elliott, W., Izquierdo, P., Patterson, D. J., & Butchart, S. H. M. (2023). A global assessment of the prevalence of current and potential future infrastructure in Key Biodiversity Areas. Biological Conservation, 281, 109953. https://doi.org/10.1016/j.biocon.2023.109953
Sims, M., Stanimirova, R., Neumann, M., Raichuk, A., & Purves, D. (2025). New Data Shows What's Driving Forest Loss Around the World. https://www.wri.org/insights/forest-loss-drivers-data-trends
Trademap. (2025). Trade Map. Trade Map. https://www.trademap.org/Index.aspx
UN DESA. (n.d.). Economic and Environmental Vulnerability Indicators. Retrieved January 26, 2026, from https://policy.desa.un.org/themes/least-developed-countries-category/ldc-identification-criteria-indicators/evi-indicators
UN DESA. (2025). 2024 Revision of World Population Prospects. https://population.un.org/wpp/
UN Energy Statistics. (2025). Energy Balance Visualization [Dataset]. https://unstats.un.org/unsd/energystats/dataPortal/
UNEP. (2021, May 12). Domestic material consumption (DMC) and DMC per capita, per GDP (Tier I). https://www.unep.org/indicator-1222
Weiss, D. J., Nelson, A., Gibson, H. S., Temperley, W., Peedell, S., Lieber, A., Hancher, M., Poyart, E., Belchior, S., Fullman, N., Mappin, B., Dalrymple, U., Rozier, J., Lucas, T. C. D., Howes, R. E., Tusting, L. S., Kang, S. Y., Cameron, E., Bisanzio, D., … Gething, P. W. (2018). A global map of travel time to cities to assess inequalities in accessibility in 2015. Nature, 553(7688), 333-336. https://doi.org/10.1038/nature25181
WHO. (2023). Global Status Report on Road Safety 2023. https://www.who.int/teams/social-determinants-of-health/safety-and-mobility/global-status-report-on-road-safety-2023
Wiedenhofer, D., Baumgart, A., Matej, S., Virág, D., Kalt, G., Lanau, M., Tingley, D. D., Liu, Z., Guo, J., Tanikawa, H., & Haberl, H. (2024). Mapping and modelling global mobility infrastructure stocks, material flows and their embodied greenhouse gas emissions [Dataset]. https://doi.org/10.1016/j.jclepro.2023.139742
World Bank. (2021). ICP 2021. https://databank.worldbank.org/source/icp-2021
World Bank. (2022a). Annual freshwater withdrawals, total (% of internal resources) [Dataset]. https://data.worldbank.org
World Bank. (2022b). Land area (sq. Km) [Dataset]. https://data.worldbank.org
World Bank. (2022c). The Global Health Cost of PM2.5 Air Pollution: A Case for Action Beyond 2021. The World Bank. https://doi.org/10.1596/978-1-4648-1816-5
World Bank. (2023). Forest area (% of land area) [Dataset]. https://data.worldbank.org/indicator/AG.LND.FRST.ZS
World Bank. (2024). Home | Logistics Performance Index (LPI). Logistics Performance Index. https://lpi.worldbank.org/
World Bank. (2025a). GDP per capita, PPP (current international $) [Dataset]. https://data.worldbank.org/indicator/NY.GDP.PCAP.PP.CD
World Bank. (2025b). GDP, PPP (current international $) [Dataset]. https://data.worldbank.org/indicator/NY.GDP.MKTP.PP.CD
World Database on Protected Areas. (2024). Protected Areas (WDPA) [Dataset]. https://www.protectedplanet.net/en/thematic-areas/wdpa?tab=WDPA