
Samoa Green Roads Profile 2025
SAMOA
GREEN ROADS PROFILESupported by:
The ATO green roads profiles present country-level perspectives on how 35 Asia-Pacific economies are addressing the development and management of sustainable eco-friendly roads. Drawing from diverse datasets and policy documents, the profiles highlight practices and measures that contribute to greener transport infrastructure.
Developed by the Asian Transport Observatory (ATO) in partnership with the International Road Federation (IRF), the profiles are designed to complement the Green Roads Toolkit. The toolkit provides a practical reference for integrating good practices across nine dimensions:
- Decarbonization
- Climate resilience
- Water and land management
- Pollution reduction
- Conserving biodiversity
- Responsible sourcing of materials
- Improving quality of life
- Disaster preparedness
- Fostering inclusive growth
This 2025 edition builds on earlier work to provide a comprehensive resource for guiding the planning, development, construction, and management of greener, more sustainable roads.
Background
Indicator - Dimension Matrix

Samoa presents a paradox of connectivity. For a Pacific island nation spread over roughly 3,000 square kilometers, the road network is surprisingly dense, measuring 565 meters of infrastructure for every square kilometer of land. Yet, this density—comprising 1,600 kilometers of predominantly local and rural roads—masks a fragility inherent to island transport systems. The network is not merely a conduit for the movement of goods and people; it is the single largest contributor to the country's transport emissions and a critical vulnerability in the face of a warming climate.
The carbon intensity of Samoan mobility is disproportionately high. While the Asia-Pacific region averages a road transport emissions intensity of roughly 26 grams of CO2 equivalent (CO2e) per USD of GDP, Samoa's intensity stands at 85 grams—more than triple the regional benchmark. This inefficiency is driven by a motorization rate that has surged to 441 vehicles per thousand people, significantly outpacing the Asia-Pacific average of 317.
The composition of this fleet dictates the policy levers available for decarbonization. Two-wheelers dominate, accounting for 52% of road users, followed by light-duty vehicles (LDVs) at 33%. Consequently, road transport emissions have climbed by 4.6% annually since 2000, now constituting 86% of all transport emissions. However, market signals indicate a nascent shift. Between 2015 and 2024, the value of electric vehicle (EV) imports reached 4 million USD, capturing 9% of total road vehicle imports by the end of that period. While currently skewed heavily toward LDVs (99% of EV imports), this uptake suggests consumer willingness to transition, provided the policy environment matures. The UNEP E-mobility Readiness Index scores Samoa at 53 out of 100, highlighting strong potential in energy and financial frameworks but identifying critical gaps in technology and market readiness.
A green road network is futile if it cannot withstand the environment it traverses. Samoa faces average annual damages to transport infrastructure estimated at 533,600 USD, or roughly 0.035% of GDP. Roads bear the brunt of this, accounting for 57% of these losses. Bridges represent a specific structural weakness; despite comprising only 0.1% of the infrastructure stock, they incur 5.9% of the road sector's financial losses.
The future climate scenario amplifies these risks. Under a 4.5-degree warming scenario, more than half (53%) of Samoa's road and rail assets would be exposed to more frequent and extreme precipitation. This vulnerability extends to the materials themselves. The current stock of 10.7 million tonnes of material in road infrastructure demands an annual input of 280,000 tonnes for maintenance and expansion, generating significant embodied carbon emissions. Building resilience is therefore not just an engineering challenge but a fiscal imperative to prevent the recurring destruction of capital.
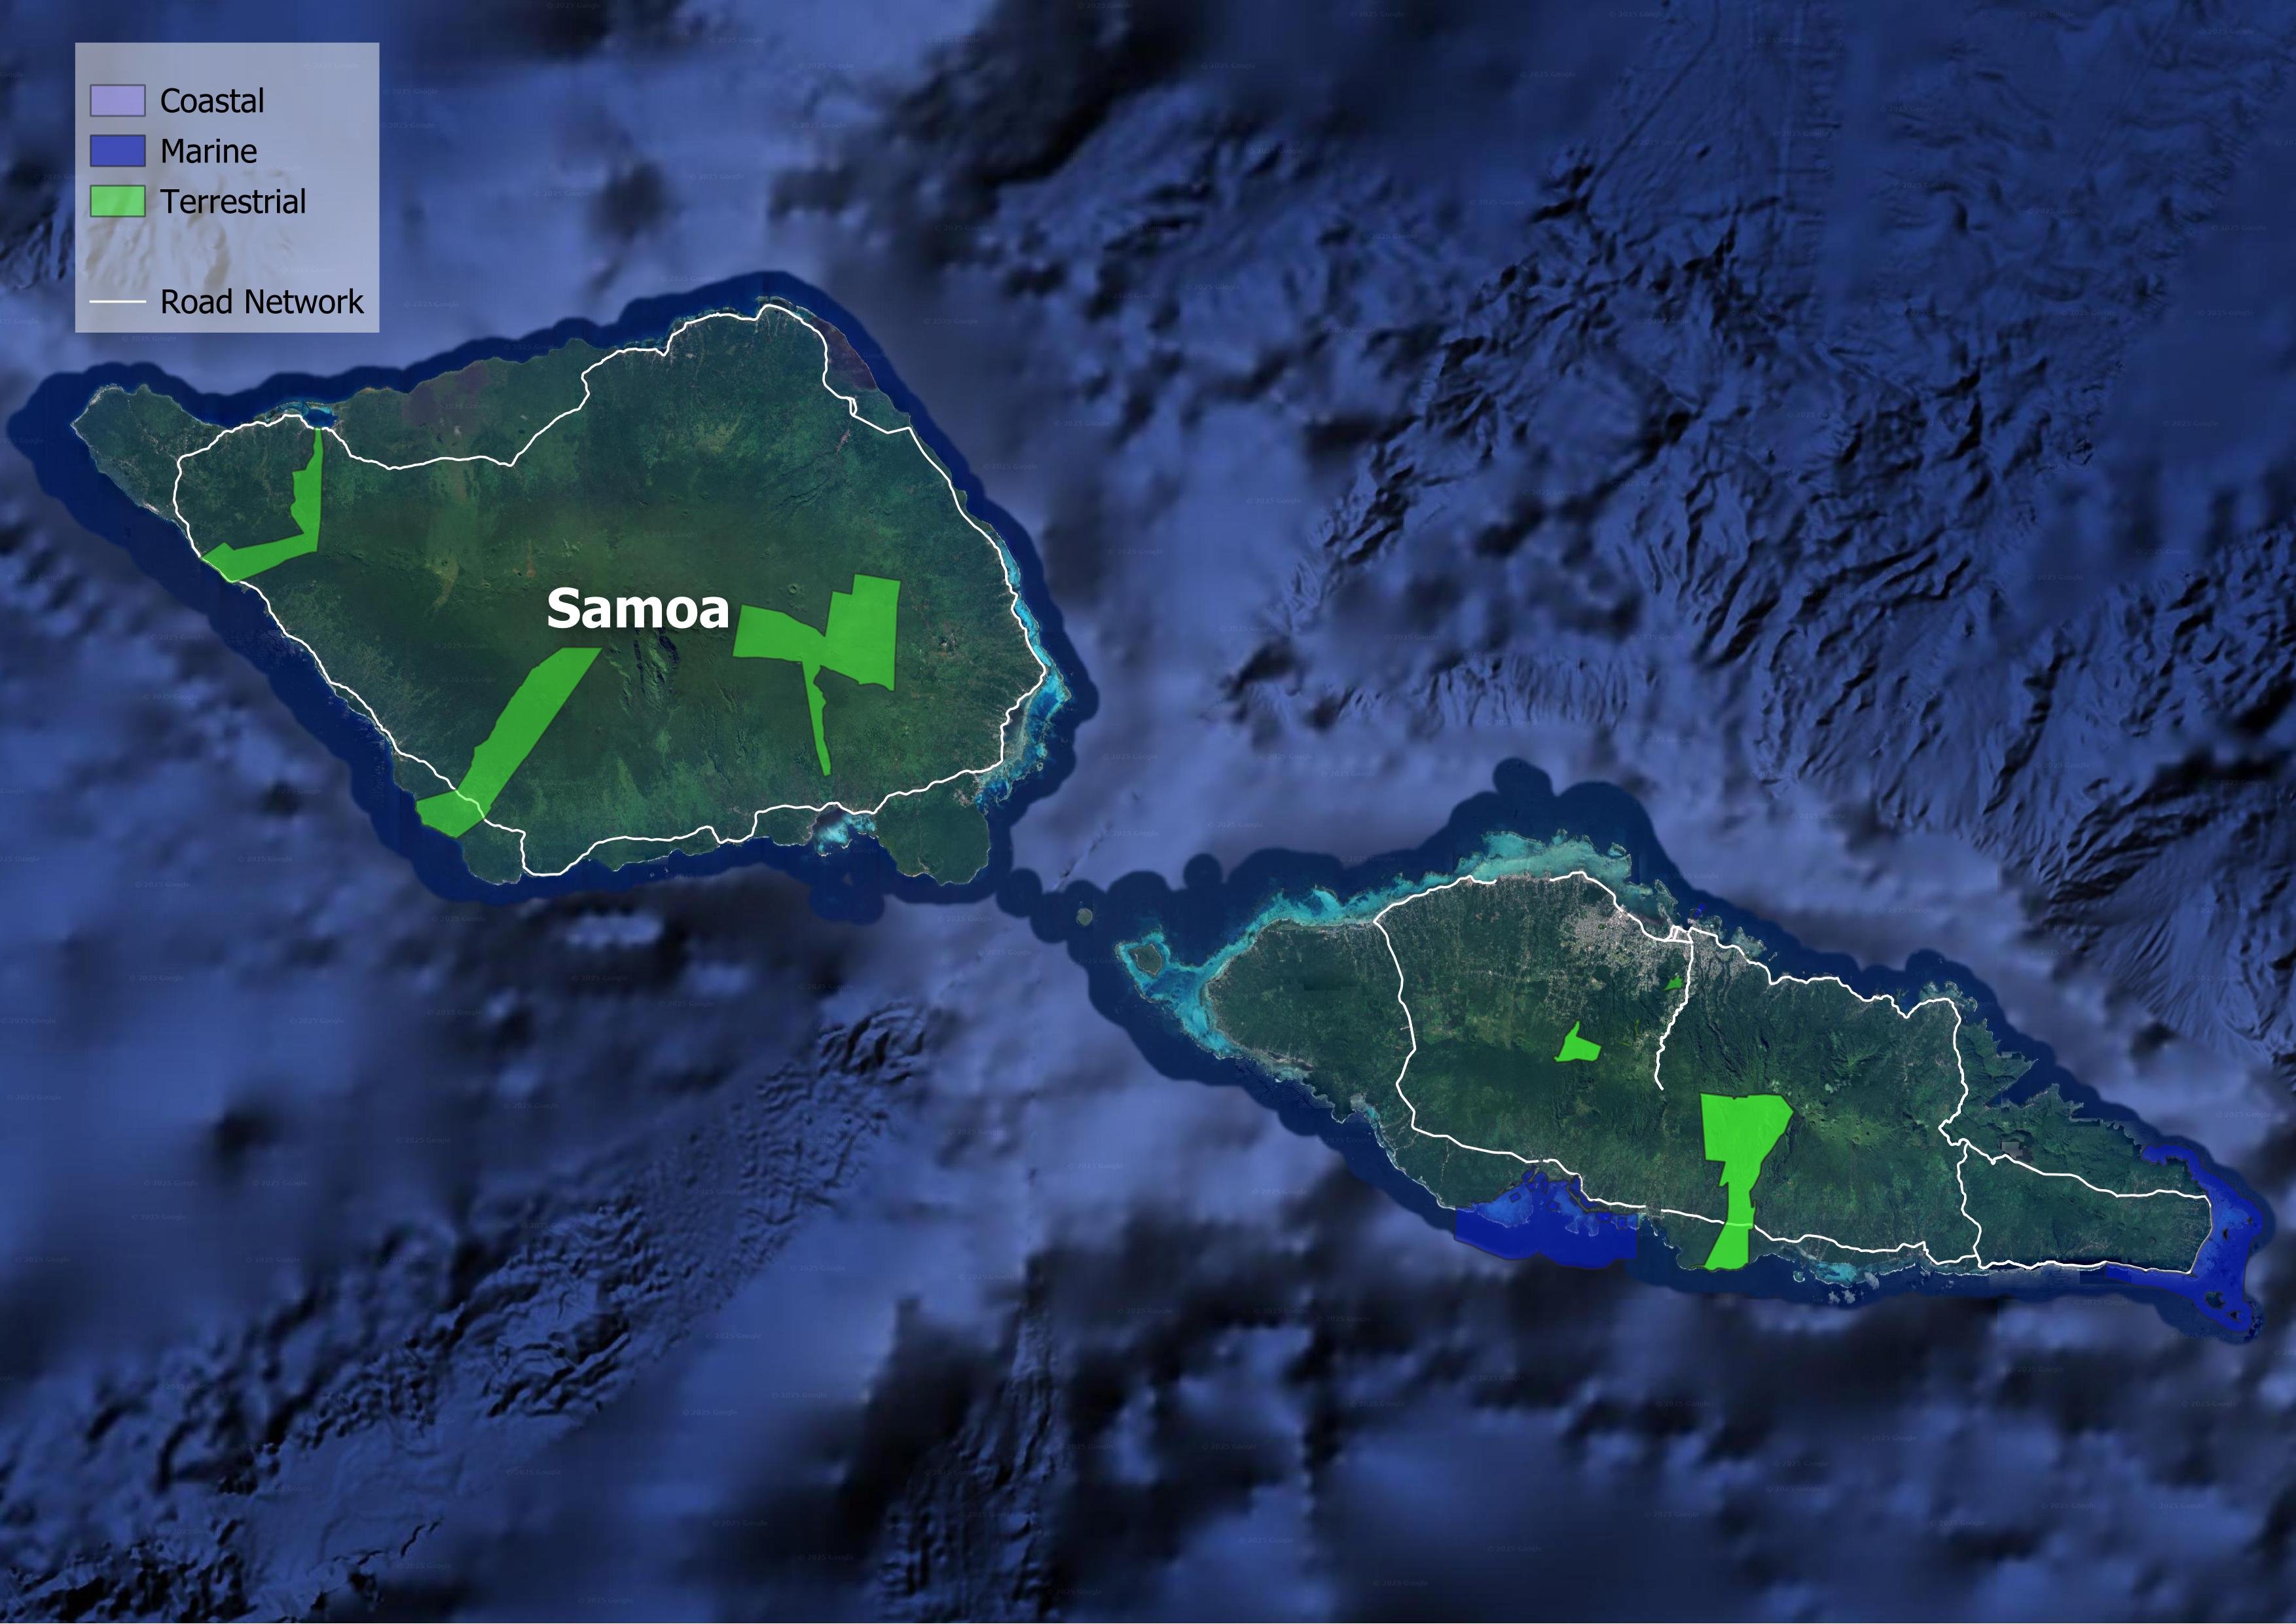
The spatial configuration of Samoa's roads creates friction with both biodiversity and social equity. The network intrudes significantly into ecological sanctuaries; of the country's eight Key Biodiversity Areas (KBAs), seven contain road infrastructure. This equates to 59 meters of road per thousand square kilometers of KBA, a footprint nearly double the Pacific Island average.
Simultaneously, the network fails to serve the most vulnerable populations effectively. Despite high road density, 36,000 rural residents live beyond the reach of all-season roads (defined as within 2 kilometers), severing their reliable access to healthcare, education, and markets. This isolation is compounded by a centralization of services that forces 58% of the population to travel more than 30 minutes to access cities.
Safety remains a persistent public health crisis. The economic burden of road crashes in Samoa is substantial. Fatalities and serious injuries in 2021 cost approximately 27 million USD, equivalent to 3% of Samoa's GDP. This figure underscores the significant impact of road crashes on the nation's economy.
Furthermore, the transport sector reflects deep gender disparities, with women comprising only 9.2% of the workforce, limiting their role in shaping the mobility systems they rely on.
Integrating Samoa's transport sector into a low-carbon, resilient future requires recalibrating investment priorities. The data points to a clear need for redirecting capital from expansion toward the hardening of critical assets—specifically bridges and rural connectors—against climate shocks. Simultaneously, policy mechanisms must accelerate the electrification of the two-wheeler segment, which dominates the fleet but lags in the EV transition. Success lies in decoupling economic activity from carbon intensity while ensuring that the road network serves as a reliable lifeline for rural communities rather than a driver of ecological degradation.
Decarbonization
Climate Resilience
Water and Land Management
Reducing Pollution
Preserving Biodiversity
Sustainable Materials Sourcing and Construction Practices
Improving Quality of life
Disaster Preparedness
Fostering Inclusive Growth
Supporting Information
Road Infrastructure Pipeline
| Central Cross Island Road Upgrading Project | 2020 | 55 million USD | 20 |
| Priority Apia CBD Road & Drainage Upgrades | None | 65 million USD | None |
| Samoa Climate Resilient Transport Project | 2025 | 35.75 million USD | None |
| West Coast Road Rehabilitation and Enhancement (Saina to Faleolo) | 2016 | 115 million USD | 24 |
Unit Cost Road Projects
Road Transport Policy Landscape
Road Transport Policy Targets
No data
Road Transport Policy Measure Types
References
AIIB. (n.d.). MEASURING TRANSPORT CONNECTIVITY FOR TRADE IN ASIA. https://impact.economist.com/perspectives/sites/default/files/eco141_aiib_transport_connectivity_4.pdf/
Asian Transport Observatory. (2025). Asia and the Pacific's Transport Infrastructure and Investment Outlook 2035. https://asiantransportobservatory.org/analytical-outputs/asia-transport-infrastructure-investment-needs/
Barrington-Leigh, C., & Millard-Ball, A. (2025). A high-resolution global time series of street-network sprawl. https://journals.sagepub.com/doi/10.1177/23998083241306829
CDRI. (2023). Global Infrastructure Risk Model and Resilience Index. https://giri.unepgrid.ch/
CIESIN. (2023a). Rural Access Index [Dataset]. https://sedac.ciesin.columbia.edu/data/set/sdgi-9-1-1-rai-2023
CIESIN. (2023b). SDG Indicator 11.2.1: Urban Access to Public Transport, 2023 Release: Sustainable Development Goal Indicators (SDGI). https://sedac.ciesin.columbia.edu/data/set/sdgi-11-2-1-urban-access-public-transport-2023
EDGAR. (2025). GHG emissions of all world countries: 2025. Publications Office. https://data.europa.eu/doi/10.2760/9816914
Ember. (2024). Electricity Data Explorer [Dataset]. https://ember-energy.org/data/electricity-data-explorer
EM-DAT. (2025). EM-DAT - The international disaster database. https://www.emdat.be/European Commission. (2024). Global Air Pollutant Emissions EDGAR v8.1 [Dataset]. https://edgar.jrc.ec.europa.eu/dataset_ap61#sources
IEA. (n.d.). Fossil Fuel Subsidies. IEA. Retrieved April 19, 2025, from https://www.iea.org/topics/fossil-fuel-subsidies
ILO. (2025). ILOSTAT [Dataset]. https://rplumber.ilo.org/files/website/bulk/indicator.html
ITDP. (2024). The Atlas of Sustainable City Transport. https://atlas.itdp.org/
Koks, E., Rozenberg, J., Tariverdi, M., Dickens, B., Fox, C., Ginkel, K. van, & Hallegatte, S. (2023). A global assessment of national road network vulnerability. Environmental Research: Infrastructure and Sustainability, 3(2), 025008. https://doi.org/10.1088/2634-4505/acd1aa
Liu, K., Wang, Q., Wang, M., & Koks, E. E. (2023). Global transportation infrastructure exposure to the change of precipitation in a warmer world. Nature Communications, 14(1), 2541. https://doi.org/10.1038/s41467-023-38203-3
McDuffie, E. E., Martin, R. V., Spadaro, J. V., Burnett, R., Smith, S. J., O'Rourke, P., Hammer, M. S., van Donkelaar, A., Bindle, L., Shah, V., Jaeglé, L., Luo, G., Yu, F., Adeniran, J. A., Lin, J., & Brauer, M. (2021). Source sector and fuel contributions to ambient PM2.5 and attributable mortality across multiple spatial scales. Nature Communications, 12(1), 3594. https://doi.org/10.1038/s41467-021-23853-y
Parry, S. B., Antung A. Liu,Ian W. H. (2023). IMF Fossil Fuel Subsidies Data: 2023 Update. IMF. https://www.imf.org/en/publications/wp/issues/2023/08/22/imf-fossil-fuel-subsidies-data-2023-update-537281
Simkins, A. T., Beresford, A. E., Buchanan, G. M., Crowe, O., Elliott, W., Izquierdo, P., Patterson, D. J., & Butchart, S. H. M. (2023). A global assessment of the prevalence of current and potential future infrastructure in Key Biodiversity Areas. Biological Conservation, 281, 109953. https://doi.org/10.1016/j.biocon.2023.109953
Sims, M., Stanimirova, R., Neumann, M., Raichuk, A., & Purves, D. (2025). New Data Shows What's Driving Forest Loss Around the World. https://www.wri.org/insights/forest-loss-drivers-data-trends
Trademap. (2025). Trade Map. Trade Map. https://www.trademap.org/Index.aspx
UN DESA. (n.d.). Economic and Environmental Vulnerability Indicators. Retrieved January 26, 2026, from https://policy.desa.un.org/themes/least-developed-countries-category/ldc-identification-criteria-indicators/evi-indicators
UN DESA. (2025). 2024 Revision of World Population Prospects. https://population.un.org/wpp/
UN Energy Statistics. (2025). Energy Balance Visualization [Dataset]. https://unstats.un.org/unsd/energystats/dataPortal/
UNEP. (2021, May 12). Domestic material consumption (DMC) and DMC per capita, per GDP (Tier I). https://www.unep.org/indicator-1222
Weiss, D. J., Nelson, A., Gibson, H. S., Temperley, W., Peedell, S., Lieber, A., Hancher, M., Poyart, E., Belchior, S., Fullman, N., Mappin, B., Dalrymple, U., Rozier, J., Lucas, T. C. D., Howes, R. E., Tusting, L. S., Kang, S. Y., Cameron, E., Bisanzio, D., … Gething, P. W. (2018). A global map of travel time to cities to assess inequalities in accessibility in 2015. Nature, 553(7688), 333-336. https://doi.org/10.1038/nature25181
WHO. (2023). Global Status Report on Road Safety 2023. https://www.who.int/teams/social-determinants-of-health/safety-and-mobility/global-status-report-on-road-safety-2023
Wiedenhofer, D., Baumgart, A., Matej, S., Virág, D., Kalt, G., Lanau, M., Tingley, D. D., Liu, Z., Guo, J., Tanikawa, H., & Haberl, H. (2024). Mapping and modelling global mobility infrastructure stocks, material flows and their embodied greenhouse gas emissions [Dataset]. https://doi.org/10.1016/j.jclepro.2023.139742
World Bank. (2021). ICP 2021. https://databank.worldbank.org/source/icp-2021
World Bank. (2022a). Annual freshwater withdrawals, total (% of internal resources) [Dataset]. https://data.worldbank.org
World Bank. (2022b). Land area (sq. Km) [Dataset]. https://data.worldbank.org
World Bank. (2022c). The Global Health Cost of PM2.5 Air Pollution: A Case for Action Beyond 2021. The World Bank. https://doi.org/10.1596/978-1-4648-1816-5
World Bank. (2023). Forest area (% of land area) [Dataset]. https://data.worldbank.org/indicator/AG.LND.FRST.ZS
World Bank. (2024). Home | Logistics Performance Index (LPI). Logistics Performance Index. https://lpi.worldbank.org/
World Bank. (2025a). GDP per capita, PPP (current international $) [Dataset]. https://data.worldbank.org/indicator/NY.GDP.PCAP.PP.CD
World Bank. (2025b). GDP, PPP (current international $) [Dataset]. https://data.worldbank.org/indicator/NY.GDP.MKTP.PP.CD
World Database on Protected Areas. (2024). Protected Areas (WDPA) [Dataset]. https://www.protectedplanet.net/en/thematic-areas/wdpa?tab=WDPA