
Philippines Green Roads Profile 2025
PHILIPPINES
GREEN ROADS PROFILESupported by:
The ATO green roads profiles present country-level perspectives on how 35 Asia-Pacific economies are addressing the development and management of sustainable eco-friendly roads. Drawing from diverse datasets and policy documents, the profiles highlight practices and measures that contribute to greener transport infrastructure.
Developed by the Asian Transport Observatory (ATO) in partnership with the International Road Federation (IRF), the profiles are designed to complement the Green Roads Toolkit. The toolkit provides a practical reference for integrating good practices across nine dimensions:
- Decarbonization
- Climate resilience
- Water and land management
- Pollution reduction
- Conserving biodiversity
- Responsible sourcing of materials
- Improving quality of life
- Disaster preparedness
- Fostering inclusive growth
This 2025 edition builds on earlier work to provide a comprehensive resource for guiding the planning, development, construction, and management of greener, more sustainable roads.
Background
Indicator - Dimension Matrix

The Philippine road network covers 324,200 kilometers, acting more like a dense web of tiny vessels tailored to the country's diverse geography. With a road density of 1,087 meters per square kilometer, the network is widespread but its usefulness varies. Most of it consists of local and rural roads (89%), while motorways and primary routes make up only 3%. This structure presents a unique "green" challenge: achieving decarbonization and resilience requires not just focusing on high-speed roads but also upgrading the detailed, community-level connections that support the economy.
The carbon footprint of this network is expanding, though efficiency gains offer a counter-narrative. Road transport GHG emissions reached 34.8 million tonnes of CO2e in 2024, accounting for a staggering 88% of total transport emissions. While these emissions have grown by 2.1% annually since 2000, the sector has demonstrated a relative decoupling of carbon from economic activity. Emissions intensity relative to GDP has fallen from 72 grams of CO2e per USD in 1990 to 25 in 2024, an improvement rate of 4.0% per year since 2015—outpacing the Southeast Asian average.
However, the vehicle fleet composition dictates that standard electrification strategies requires localized adaptation. Two-wheelers comprise 49% of road users, dwarfing light duty vehicles (14%) and buses (20%). Consequently, the electrification conversation cannot focus solely on electric cars. Although EV imports reached $523 million between 2015 and 2024, they still represent only 4% of road vehicle imports, largely skewed toward light-duty vehicles rather than the two-wheelers that dominate the streetscape. Furthermore, the environmental dividend of electrification is currently capped by the power sector; the grid emission factor stands at 612 gCO2 per kWh, a 1.3% regression since 2015, lagging behind the improving regional average in Asia-Pacific.
Beyond tailpipe emissions, the physical road infrastructure—approaching 1.48 billion tonnes of material—serves as a major store of embodied carbon. Each year, maintenance and expansion activities utilize about 30.9 million tonnes of material, resulting in roughly 1.2 million tonnes of embodied CO2-equivalent emissions. This material footprint faces growing threats from a volatile climate.
The fiscal exposure is acute. The Philippines faces potential average annual losses of $347.8 million to transport infrastructure, with 85% of these losses attributed specifically to roads. Bridges and tunnels, while only 0.3% of the infrastructure stock, bear a disproportionate risk, accounting for 4.8% of losses. Future scenarios suggest this fragility will intensify; under a 4.5-degree warming trajectory, more than 15% of road and rail assets would be exposed to frequent and extreme precipitation. This reality transforms road maintenance from a routine engineering task into a critical climate adaptation strategy.
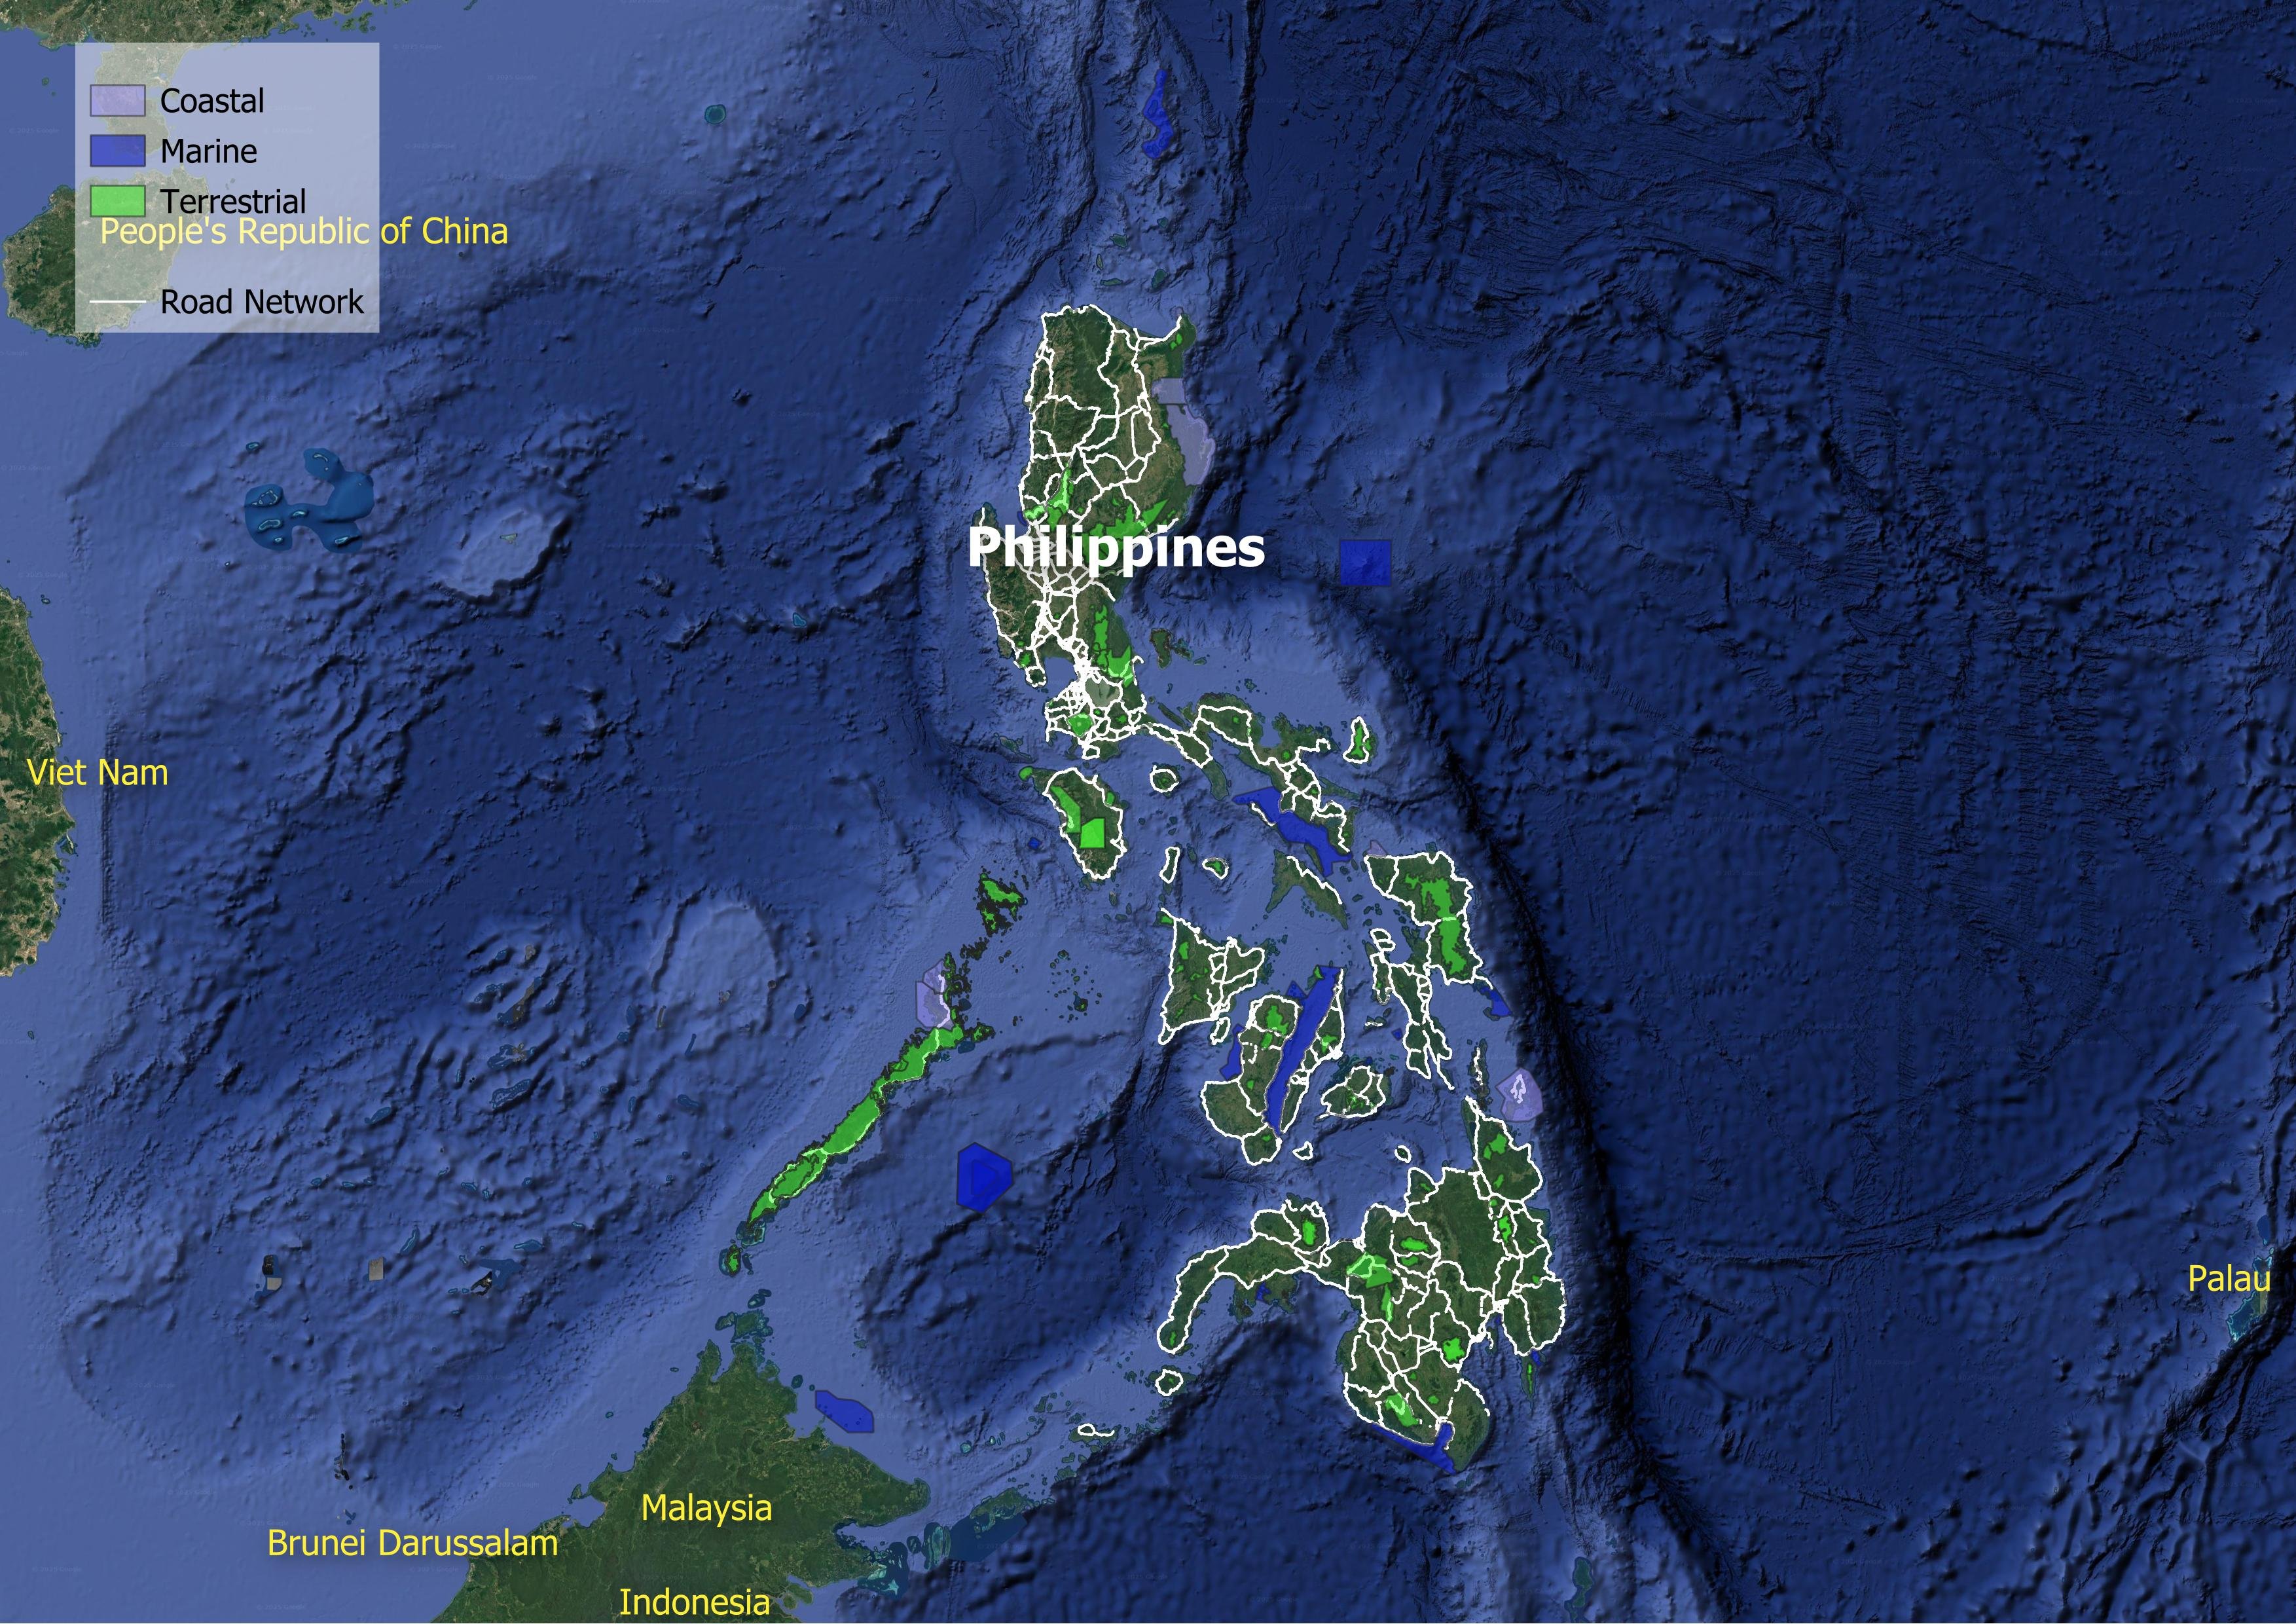
The expansion of the road network also creates friction with the country's ecological and social fabric. Biodiversity is under pressure, with road infrastructure now present in 109 of the Philippines' 130 Key Biodiversity Areas (KBAs), equating to 115 meters of road per thousand square kilometers of protected land—significantly higher than the Southeast Asian average.
Simultaneously, the network struggles to deliver equitable safety and access. Road crash fatalities remain a persistent crisis, with the World Health Organization estimating over 11,000 deaths in 2021. Road crashes impose a significant economic burden on the Philippines. Fatalities and serious injuries cost an estimated 11 billion USD in 2021, equivalent to roughly 3% of the country's GDP in addition to healthcare expenditure of 5.9% of GDP in the same year, highlighting the substantial strain on resources.
Access disparities further isolate vulnerable populations; 7 million rural residents live beyond the reach of all-season roads, severing them from healthcare and markets, while in urban areas, only 20% of residents in the majority of cities have adequate access to public transport.
Transitioning to "Green Roads" in the Philippines requires a pivot from simple expansion to integrated asset management. Policy frameworks must therefore evolve from simple connectivity targets to a holistic "Green Roads" standard. This approach necessitates a shift in investment priorities: prioritizing the resilience of existing assets over indiscriminate expansion, integrating biodiversity corridors into road planning, and accelerating the clean energy transition to support a burgeoning EV market. It also requires addressing the stark inequity of access, where only 20% of residents in the majority of cities have convenient access to public transport, and transport costs consume nearly 8% of household expenditures. A truly green road network is one that serves the economy without bankrupting the environment or leaving the most vulnerable populations behind.
Decarbonization
Climate Resilience
Water and Land Management
Reducing Pollution
Preserving Biodiversity
Sustainable Materials Sourcing and Construction Practices
Improving Quality of life
Disaster Preparedness
Fostering Inclusive Growth
Supporting Information
Road Infrastructure Pipeline
| Metro Manila Interchange Construction Project (VI) | 2015 | None | None |
| Metro Manila Priority Bridges Seismic Improvement Project | 2015 | None | None |
| Metro Manila Priority Bridges Seismic Improvement Project (II) | 2020 | None | None |
| Arterial Road Bypass Project (Phase III) | 2018 | None | None |
| Bataan–Cavite Interlink Bridge Project | 2023 | 4354.78 million USD | None |
| Bataan–Cavite Interlink Bridge Project, Tranche 1 | 2023 | 1310.78 million USD | 32 |
| Cebu-Mactan Bridge 4th Bridgeand Coastal Road Construction Project | 2020 | None | None |
| Dalton Pass East Alignment Road Project (I) | 2024 | None | None |
| Davao City Bypass Construction Project (II) | 2020 | None | None |
| Davao City Bypass Construction Project (III) | 2025 | None | None |
| Davao City Bypass Construction Project (South and Center Sections) | 2015 | None | None |
| Epifanio de los Santos Avenue Greenways Project | 2020 | 179.3 million USD | None |
| Improving Growth Corridors in Mindanao Road Sector Project | 2017 | 503 million USD | 280 |
| Laguna Lakeshore Road Network Project | 2024 | 2435.69 million USD | None |
| Laguna Lakeshore Road Network Project Tranche 1 | 2024 | 1710.26 million USD | None |
| Metro Manila Bridges Project | 2021 | 247.5 million USD | None |
| Philippines: Bataan-Cavite Interlink Bridge Project and Tranche 1 | 2024 | None | None |
| Philippines: Laguna Lakeshore Road Network (Phase 1) Project | 2024 | None | 12.23 |
| Road Network Development Project in Conflict Affected Areas in Mindanao | 2019 | None | None |
Unit Cost Road Projects
Road Transport Policy Landscape
Road Transport Policy Targets
| Philippine Development Plan 2023-2028 | 2028 | Road traffic accident (crash) rate reduced (number of incidents per 100,000 population) - incidents of accidents (crash) = 2.50 (from 3.85 in 2021) |
| Philippine Development Plan 2023-2028 | 2028 | Travel time (decreased) via land per key corridor (hours) = 3.207 (from 2.38 in 2021) |
Road Transport Policy Measure Types
References
AIIB. (n.d.). MEASURING TRANSPORT CONNECTIVITY FOR TRADE IN ASIA. https://impact.economist.com/perspectives/sites/default/files/eco141_aiib_transport_connectivity_4.pdf/
Asian Transport Observatory. (2025). Asia and the Pacific's Transport Infrastructure and Investment Outlook 2035. https://asiantransportobservatory.org/analytical-outputs/asia-transport-infrastructure-investment-needs/
Barrington-Leigh, C., & Millard-Ball, A. (2025). A high-resolution global time series of street-network sprawl. https://journals.sagepub.com/doi/10.1177/23998083241306829
CDRI. (2023). Global Infrastructure Risk Model and Resilience Index. https://giri.unepgrid.ch/
CIESIN. (2023a). Rural Access Index [Dataset]. https://sedac.ciesin.columbia.edu/data/set/sdgi-9-1-1-rai-2023
CIESIN. (2023b). SDG Indicator 11.2.1: Urban Access to Public Transport, 2023 Release: Sustainable Development Goal Indicators (SDGI). https://sedac.ciesin.columbia.edu/data/set/sdgi-11-2-1-urban-access-public-transport-2023
EDGAR. (2025). GHG emissions of all world countries: 2025. Publications Office. https://data.europa.eu/doi/10.2760/9816914
Ember. (2024). Electricity Data Explorer [Dataset]. https://ember-energy.org/data/electricity-data-explorer
EM-DAT. (2025). EM-DAT - The international disaster database. https://www.emdat.be/European Commission. (2024). Global Air Pollutant Emissions EDGAR v8.1 [Dataset]. https://edgar.jrc.ec.europa.eu/dataset_ap61#sources
IEA. (n.d.). Fossil Fuel Subsidies. IEA. Retrieved April 19, 2025, from https://www.iea.org/topics/fossil-fuel-subsidies
ILO. (2025). ILOSTAT [Dataset]. https://rplumber.ilo.org/files/website/bulk/indicator.html
ITDP. (2024). The Atlas of Sustainable City Transport. https://atlas.itdp.org/
Koks, E., Rozenberg, J., Tariverdi, M., Dickens, B., Fox, C., Ginkel, K. van, & Hallegatte, S. (2023). A global assessment of national road network vulnerability. Environmental Research: Infrastructure and Sustainability, 3(2), 025008. https://doi.org/10.1088/2634-4505/acd1aa
Liu, K., Wang, Q., Wang, M., & Koks, E. E. (2023). Global transportation infrastructure exposure to the change of precipitation in a warmer world. Nature Communications, 14(1), 2541. https://doi.org/10.1038/s41467-023-38203-3
McDuffie, E. E., Martin, R. V., Spadaro, J. V., Burnett, R., Smith, S. J., O'Rourke, P., Hammer, M. S., van Donkelaar, A., Bindle, L., Shah, V., Jaeglé, L., Luo, G., Yu, F., Adeniran, J. A., Lin, J., & Brauer, M. (2021). Source sector and fuel contributions to ambient PM2.5 and attributable mortality across multiple spatial scales. Nature Communications, 12(1), 3594. https://doi.org/10.1038/s41467-021-23853-y
Parry, S. B., Antung A. Liu,Ian W. H. (2023). IMF Fossil Fuel Subsidies Data: 2023 Update. IMF. https://www.imf.org/en/publications/wp/issues/2023/08/22/imf-fossil-fuel-subsidies-data-2023-update-537281
Simkins, A. T., Beresford, A. E., Buchanan, G. M., Crowe, O., Elliott, W., Izquierdo, P., Patterson, D. J., & Butchart, S. H. M. (2023). A global assessment of the prevalence of current and potential future infrastructure in Key Biodiversity Areas. Biological Conservation, 281, 109953. https://doi.org/10.1016/j.biocon.2023.109953
Sims, M., Stanimirova, R., Neumann, M., Raichuk, A., & Purves, D. (2025). New Data Shows What's Driving Forest Loss Around the World. https://www.wri.org/insights/forest-loss-drivers-data-trends
Trademap. (2025). Trade Map. Trade Map. https://www.trademap.org/Index.aspx
UN DESA. (n.d.). Economic and Environmental Vulnerability Indicators. Retrieved January 26, 2026, from https://policy.desa.un.org/themes/least-developed-countries-category/ldc-identification-criteria-indicators/evi-indicators
UN DESA. (2025). 2024 Revision of World Population Prospects. https://population.un.org/wpp/
UN Energy Statistics. (2025). Energy Balance Visualization [Dataset]. https://unstats.un.org/unsd/energystats/dataPortal/
UNEP. (2021, May 12). Domestic material consumption (DMC) and DMC per capita, per GDP (Tier I). https://www.unep.org/indicator-1222
Weiss, D. J., Nelson, A., Gibson, H. S., Temperley, W., Peedell, S., Lieber, A., Hancher, M., Poyart, E., Belchior, S., Fullman, N., Mappin, B., Dalrymple, U., Rozier, J., Lucas, T. C. D., Howes, R. E., Tusting, L. S., Kang, S. Y., Cameron, E., Bisanzio, D., … Gething, P. W. (2018). A global map of travel time to cities to assess inequalities in accessibility in 2015. Nature, 553(7688), 333-336. https://doi.org/10.1038/nature25181
WHO. (2023). Global Status Report on Road Safety 2023. https://www.who.int/teams/social-determinants-of-health/safety-and-mobility/global-status-report-on-road-safety-2023
Wiedenhofer, D., Baumgart, A., Matej, S., Virág, D., Kalt, G., Lanau, M., Tingley, D. D., Liu, Z., Guo, J., Tanikawa, H., & Haberl, H. (2024). Mapping and modelling global mobility infrastructure stocks, material flows and their embodied greenhouse gas emissions [Dataset]. https://doi.org/10.1016/j.jclepro.2023.139742
World Bank. (2021). ICP 2021. https://databank.worldbank.org/source/icp-2021
World Bank. (2022a). Annual freshwater withdrawals, total (% of internal resources) [Dataset]. https://data.worldbank.org
World Bank. (2022b). Land area (sq. Km) [Dataset]. https://data.worldbank.org
World Bank. (2022c). The Global Health Cost of PM2.5 Air Pollution: A Case for Action Beyond 2021. The World Bank. https://doi.org/10.1596/978-1-4648-1816-5
World Bank. (2023). Forest area (% of land area) [Dataset]. https://data.worldbank.org/indicator/AG.LND.FRST.ZS
World Bank. (2024). Home | Logistics Performance Index (LPI). Logistics Performance Index. https://lpi.worldbank.org/
World Bank. (2025a). GDP per capita, PPP (current international $) [Dataset]. https://data.worldbank.org/indicator/NY.GDP.PCAP.PP.CD
World Bank. (2025b). GDP, PPP (current international $) [Dataset]. https://data.worldbank.org/indicator/NY.GDP.MKTP.PP.CD
World Database on Protected Areas. (2024). Protected Areas (WDPA) [Dataset]. https://www.protectedplanet.net/en/thematic-areas/wdpa?tab=WDPA