
Papua New Guinea Green Roads Profile 2025
PAPUA NEW GUINEA
GREEN ROADS PROFILESupported by:
The ATO green roads profiles present country-level perspectives on how 35 Asia-Pacific economies are addressing the development and management of sustainable eco-friendly roads. Drawing from diverse datasets and policy documents, the profiles highlight practices and measures that contribute to greener transport infrastructure.
Developed by the Asian Transport Observatory (ATO) in partnership with the International Road Federation (IRF), the profiles are designed to complement the Green Roads Toolkit. The toolkit provides a practical reference for integrating good practices across nine dimensions:
- Decarbonization
- Climate resilience
- Water and land management
- Pollution reduction
- Conserving biodiversity
- Responsible sourcing of materials
- Improving quality of life
- Disaster preparedness
- Fostering inclusive growth
This 2025 edition builds on earlier work to provide a comprehensive resource for guiding the planning, development, construction, and management of greener, more sustainable roads.
Background
Indicator - Dimension Matrix

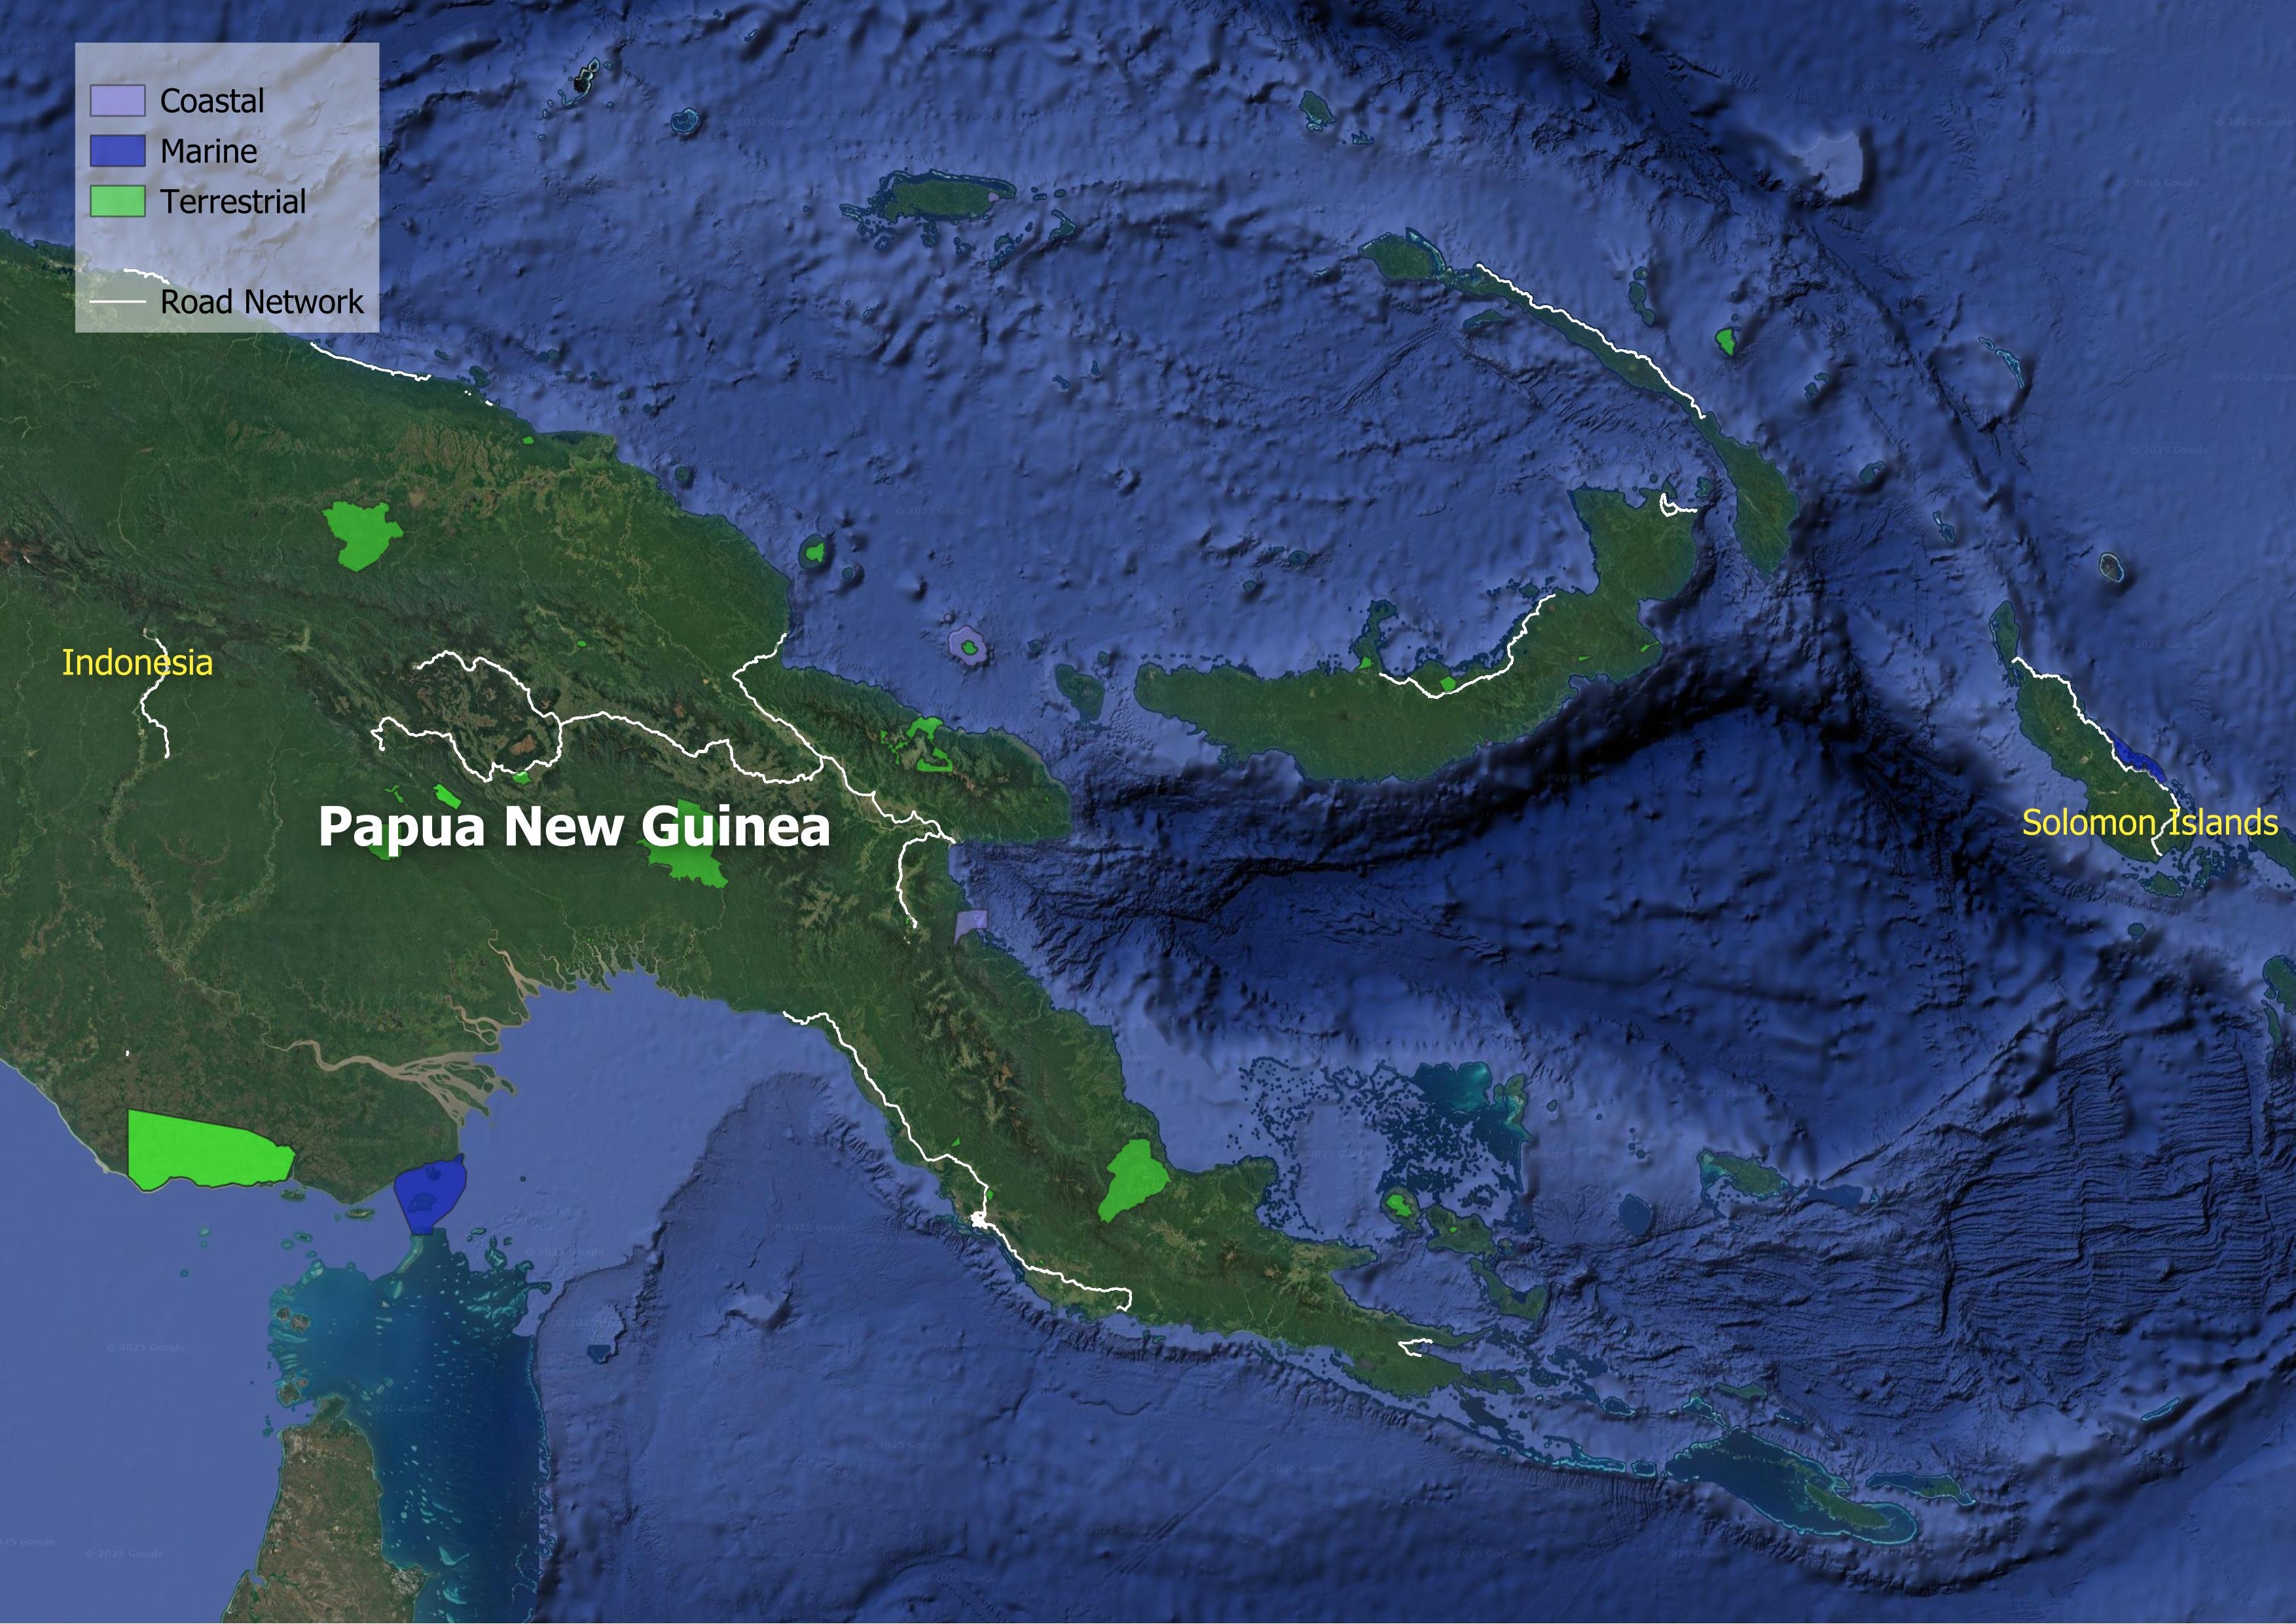
Papua New Guinea's (PNG) transport landscape presents a distinct paradox of high mobility demand juxtaposed with infrastructure fragility. The archipelago's road network, spanning roughly 37,000 kilometers, acts as the primary circulatory system for a population of 10.6 million. Yet, the composition of this network reveals a critical vulnerability: 90% consists of local and rural roads, while only 1% falls under the classification of motorways or primary arteries. This heavy reliance on lower-tier infrastructure underscores the challenge of maintaining connectivity across a rugged, geologically volatile terrain where road availability has barely inched upward—from 3.3 kilometers per thousand people in 2000 to 3.5 in 2024.
The narrative of "Green Roads" in PNG is not merely about decarbonization; it is fundamentally about survival and equity. While the country boasts a motorization rate of 407 vehicles per thousand people—surpassing the Asia-Pacific average of 317—this abundance of vehicles has not translated into universal access. A staggering 4.7 million rural residents remain cut off from all-season roads, effectively isolating nearly half the population from healthcare, education, and markets. This isolation is compounded by urban divide, where 87% of the population must travel more than 30 minutes to access a city, and public transport availability in urban agglomerations remains critically low.
From an emissions perspective, the transport sector is a heavyweight, accounting for 17% of economy-wide greenhouse gas (GHG) output. Road transport emissions have climbed by 4.5% annually since 2000, reaching 1.8 million tonnes of CO2e in 2024. However, the data reveals a promising decoupling of growth and carbon: emissions intensity per unit of GDP has fallen from 124 grams of CO2e per USD in 1990 to 35 grams in 2024, an improvement rate outpacing both the wider Asia-Pacific and Pacific Island averages since 2015.
The fleet profile offers a unique leverage point for decarbonization. Unlike markets dominated by private cars, PNG's roads are ruled by two-wheelers (52%) and light-duty vehicles (33%). Interestingly, the nascent electric vehicle (EV) transition is bypassing the consumer passenger segment entirely. Of the $27 million in EV imports recorded between 2015 and 2024, 98% consisted of goods vehicles and buses, suggesting a commercial-led shift toward electrification. While UNEP's E-mobility Readiness Index scores the country at a modest 43 out of 100, the high share of commercial EV imports indicates a market logic already favoring electric heavy-duty transport.
The human and economic toll of the current fossil-fuel dependent system is severe. Air pollution, largely driven by transport, exacts a health cost estimated by the World Bank at $4.8 billion annually—equivalent to roughly 12% of GDP. Tailpipe emissions contribute significantly to this burden, with at least 53 premature deaths attributed to PM 2.5 and ozone exposure. Furthermore, fossil fuel subsidies distort the market, masking external societal costs related to crashes, congestion, and road damage.
Perhaps the most urgent dimension of the green roads agenda is physical resilience. PNG ranks 207th out of 208 countries in the National Road Vulnerability Index, a metric reflecting the catastrophic connectivity failure that occurs when key road segments are lost. The financial loss is constant; the country faces average annual losses of $3.8 million to transport infrastructure, 86% of which stems from road damage. Under a 4.5-degree warming scenario, nearly 30% of road and rail assets would face exposure to extreme precipitation.
Constructing resilience must be balanced against ecological preservation in a nation where 79% of the land is forested. The tension is palpable: research indicates that 51 of 125 Key Biodiversity Areas already contain road infrastructure. Upcoming projects threaten to disturb vast carbon stocks and nitrogen retention systems, with UNEP risk modeling assigning high environmental risk scores to planned expansions. Yet, these same projects promise $240 million in economic benefits and thousands of jobs.
Policymakers in Papua New Guinea face a dual imperative: hardening the existing network against an increasingly hostile climate while leapfrogging to a cleaner fleet. The data suggests that future investment could favor upgrading the resilience of critical rural arteries that serve the isolated 4.7 million. Simultaneously, the organic shift toward electric commercial vehicles offers a clear signal to regulators to incentivize charging infrastructure for heavy transport.
Decarbonization
Climate Resilience
Water and Land Management
Reducing Pollution
Preserving Biodiversity
Sustainable Materials Sourcing and Construction Practices
Improving Quality of life
Disaster Preparedness
Fostering Inclusive Growth
Supporting Information
Road Infrastructure Pipeline
| Gulf – Morobe: Kaintiba to Aseki Link | 2015 | None | None |
| Gulf Province – Erave to Semerigi Link | 2015 | None | None |
| Highlands Region Road Improvement Investment Program, Project 3 (additional financing) | 2020 | None | None |
| Madang – Baiyer (Western Highlands) Link | 2015 | None | None |
| MTDP IV Strategic Corridors – Baiyer–Madang Corridor | 2023 | None | None |
| MTDP IV Strategic Corridors – Highlands Corridor | 2023 | None | None |
| MTDP IV Strategic Corridors – Trans-Island Corridor | 2023 | None | None |
| Sustainable Highlands Highway Investment Program | 2017 | 840 million USD | None |
| Sustainable Highlands Highway Investment Program, Tranche 2 | 2021 | 325 million USD | None |
| Sustainable Highlands Region Core Road Network Project | 2024 | 281.6 million USD | None |
Road User Charging
| Actual maintenance budget | 50 |
| Required maintenance budget | 193 |
| Maintenance budget deficit | 143 |
| Fuel excise tax | 91 |
| Vehicle registration fee | 27.34 |
| Driving license fee | 4.46 |
| Goods and services tax | 51 |
Unit Cost Road Projects
Road Transport Policy Landscape
Road Transport Policy Targets
| Development Strategic Plan 2010-2030 | 2030 | Triple road network A comprehensive program of rehabilitation and construction is advocated that will expand PNG‟s national road network that is in good condition to 25,000 kilometres by 2030 |
| Medium Term Development Plan IV 2023-2027 | 2027 | It will involve improving all Provincial and District roads, and construct 2,500km of new roads to the existing National road network by 2027. It identifies 14 major Corridors of which seven are prioritised in the MTDP IV: Trans-Island Corridor, Southern Corridor, Momase Corridor, Gulf-Southern Highlands Corridor, New Britain Corridor, Highlands Corridor and the Baiyer-Madang Corridor. |
| Medium Term Development Plan IV 2023-2027 | 2040 | The objective of the Connect PNG Road Program is to achieve 100% National road connectivity by 2040. |
| National Transport Strategy | 2050 | Increase the national road network from the current 25,000 km to complete road networks throughout Papua New Guinea |
| PNG Vision 2050 | 2050 | Increase the national road network from the current 25,000 km8 to complete road networks throughout Papua New Guinea |
| Medium Term Development Plan IV 2023-2027 | 2040 | The objective of the Connect PNG Road Program is to achieve 100% National road connectivity by 2040. |
| Development Strategic Plan 2010-2030 | 2030 | Maintain 100% of roads |
| National Roads Network Strategy 2036 | 2028 | All sealed/unselad priority non-core and core roads in fair to good condition are provided routine and periodic maintenance. Twenty percent of sealed and unsealed roads in fair and good condition are resealed/regraveled annually All sealed priority non-core roads in poor condition are in fair or good condition by 2028 All unsealed priority non-core roads in poor condition are in fair or good condition by 2028 All core and priority non-core sealed roads will be in fair or good condition by 2028 All core and priority non-core unsealed roads will be in fair or good condition by 2028 All routine maintenance costs for non-priority roads are included in phase 2 budget requirements |
| National Roads Network Strategy 2036 | 2037 | All sealed non-priority roads in poor condition are brought to fair or good condition by 2037 All unsealed non-priority roads in poor condition are brought to fair or good condition by 2037 All routine and periodic maintenance costs for the core and priority non-core roads are included in the phase 3 budget requirement All NRN sealed roads will be in fair or good condition by 2037 All NRN unsealed roads will be in fair or good condition by 2037 |
| Road Management and Maintenance Plan (RMMP) 2025–2040 | 2040 | The RMMP supports the program by ensuring that newly constructed roads are properly maintained and that missing links are connected. The Connect PNG Program targets the development of: • Strategic Economic Roads (16,579 km), • Priority National Roads (5,677 km), • Missing Link Roads (1,900 km), • Provincial and District Roads (9,000 km), and • Bridges (3,000 meters). |
Road Transport Policy Measure Types
References
AIIB. (n.d.). MEASURING TRANSPORT CONNECTIVITY FOR TRADE IN ASIA. https://impact.economist.com/perspectives/sites/default/files/eco141_aiib_transport_connectivity_4.pdf/
Asian Transport Observatory. (2025). Asia and the Pacific's Transport Infrastructure and Investment Outlook 2035. https://asiantransportobservatory.org/analytical-outputs/asia-transport-infrastructure-investment-needs/
Barrington-Leigh, C., & Millard-Ball, A. (2025). A high-resolution global time series of street-network sprawl. https://journals.sagepub.com/doi/10.1177/23998083241306829
CDRI. (2023). Global Infrastructure Risk Model and Resilience Index. https://giri.unepgrid.ch/
CIESIN. (2023a). Rural Access Index [Dataset]. https://sedac.ciesin.columbia.edu/data/set/sdgi-9-1-1-rai-2023
CIESIN. (2023b). SDG Indicator 11.2.1: Urban Access to Public Transport, 2023 Release: Sustainable Development Goal Indicators (SDGI). https://sedac.ciesin.columbia.edu/data/set/sdgi-11-2-1-urban-access-public-transport-2023
EDGAR. (2025). GHG emissions of all world countries: 2025. Publications Office. https://data.europa.eu/doi/10.2760/9816914
Ember. (2024). Electricity Data Explorer [Dataset]. https://ember-energy.org/data/electricity-data-explorer
EM-DAT. (2025). EM-DAT - The international disaster database. https://www.emdat.be/European Commission. (2024). Global Air Pollutant Emissions EDGAR v8.1 [Dataset]. https://edgar.jrc.ec.europa.eu/dataset_ap61#sources
IEA. (n.d.). Fossil Fuel Subsidies. IEA. Retrieved April 19, 2025, from https://www.iea.org/topics/fossil-fuel-subsidies
ILO. (2025). ILOSTAT [Dataset]. https://rplumber.ilo.org/files/website/bulk/indicator.html
ITDP. (2024). The Atlas of Sustainable City Transport. https://atlas.itdp.org/
Koks, E., Rozenberg, J., Tariverdi, M., Dickens, B., Fox, C., Ginkel, K. van, & Hallegatte, S. (2023). A global assessment of national road network vulnerability. Environmental Research: Infrastructure and Sustainability, 3(2), 025008. https://doi.org/10.1088/2634-4505/acd1aa
Liu, K., Wang, Q., Wang, M., & Koks, E. E. (2023). Global transportation infrastructure exposure to the change of precipitation in a warmer world. Nature Communications, 14(1), 2541. https://doi.org/10.1038/s41467-023-38203-3
McDuffie, E. E., Martin, R. V., Spadaro, J. V., Burnett, R., Smith, S. J., O'Rourke, P., Hammer, M. S., van Donkelaar, A., Bindle, L., Shah, V., Jaeglé, L., Luo, G., Yu, F., Adeniran, J. A., Lin, J., & Brauer, M. (2021). Source sector and fuel contributions to ambient PM2.5 and attributable mortality across multiple spatial scales. Nature Communications, 12(1), 3594. https://doi.org/10.1038/s41467-021-23853-y
Parry, S. B., Antung A. Liu,Ian W. H. (2023). IMF Fossil Fuel Subsidies Data: 2023 Update. IMF. https://www.imf.org/en/publications/wp/issues/2023/08/22/imf-fossil-fuel-subsidies-data-2023-update-537281
Simkins, A. T., Beresford, A. E., Buchanan, G. M., Crowe, O., Elliott, W., Izquierdo, P., Patterson, D. J., & Butchart, S. H. M. (2023). A global assessment of the prevalence of current and potential future infrastructure in Key Biodiversity Areas. Biological Conservation, 281, 109953. https://doi.org/10.1016/j.biocon.2023.109953
Sims, M., Stanimirova, R., Neumann, M., Raichuk, A., & Purves, D. (2025). New Data Shows What's Driving Forest Loss Around the World. https://www.wri.org/insights/forest-loss-drivers-data-trends
Trademap. (2025). Trade Map. Trade Map. https://www.trademap.org/Index.aspx
UN DESA. (n.d.). Economic and Environmental Vulnerability Indicators. Retrieved January 26, 2026, from https://policy.desa.un.org/themes/least-developed-countries-category/ldc-identification-criteria-indicators/evi-indicators
UN DESA. (2025). 2024 Revision of World Population Prospects. https://population.un.org/wpp/
UN Energy Statistics. (2025). Energy Balance Visualization [Dataset]. https://unstats.un.org/unsd/energystats/dataPortal/
UNEP. (2021, May 12). Domestic material consumption (DMC) and DMC per capita, per GDP (Tier I). https://www.unep.org/indicator-1222
Weiss, D. J., Nelson, A., Gibson, H. S., Temperley, W., Peedell, S., Lieber, A., Hancher, M., Poyart, E., Belchior, S., Fullman, N., Mappin, B., Dalrymple, U., Rozier, J., Lucas, T. C. D., Howes, R. E., Tusting, L. S., Kang, S. Y., Cameron, E., Bisanzio, D., … Gething, P. W. (2018). A global map of travel time to cities to assess inequalities in accessibility in 2015. Nature, 553(7688), 333-336. https://doi.org/10.1038/nature25181
WHO. (2023). Global Status Report on Road Safety 2023. https://www.who.int/teams/social-determinants-of-health/safety-and-mobility/global-status-report-on-road-safety-2023
Wiedenhofer, D., Baumgart, A., Matej, S., Virág, D., Kalt, G., Lanau, M., Tingley, D. D., Liu, Z., Guo, J., Tanikawa, H., & Haberl, H. (2024). Mapping and modelling global mobility infrastructure stocks, material flows and their embodied greenhouse gas emissions [Dataset]. https://doi.org/10.1016/j.jclepro.2023.139742
World Bank. (2021). ICP 2021. https://databank.worldbank.org/source/icp-2021
World Bank. (2022a). Annual freshwater withdrawals, total (% of internal resources) [Dataset]. https://data.worldbank.org
World Bank. (2022b). Land area (sq. Km) [Dataset]. https://data.worldbank.org
World Bank. (2022c). The Global Health Cost of PM2.5 Air Pollution: A Case for Action Beyond 2021. The World Bank. https://doi.org/10.1596/978-1-4648-1816-5
World Bank. (2023). Forest area (% of land area) [Dataset]. https://data.worldbank.org/indicator/AG.LND.FRST.ZS
World Bank. (2024). Home | Logistics Performance Index (LPI). Logistics Performance Index. https://lpi.worldbank.org/
World Bank. (2025a). GDP per capita, PPP (current international $) [Dataset]. https://data.worldbank.org/indicator/NY.GDP.PCAP.PP.CD
World Bank. (2025b). GDP, PPP (current international $) [Dataset]. https://data.worldbank.org/indicator/NY.GDP.MKTP.PP.CD
World Database on Protected Areas. (2024). Protected Areas (WDPA) [Dataset]. https://www.protectedplanet.net/en/thematic-areas/wdpa?tab=WDPA