
Pakistan Green Roads Profile 2025
PAKISTAN
GREEN ROADS PROFILESupported by:
The ATO green roads profiles present country-level perspectives on how 35 Asia-Pacific economies are addressing the development and management of sustainable eco-friendly roads. Drawing from diverse datasets and policy documents, the profiles highlight practices and measures that contribute to greener transport infrastructure.
Developed by the Asian Transport Observatory (ATO) in partnership with the International Road Federation (IRF), the profiles are designed to complement the Green Roads Toolkit. The toolkit provides a practical reference for integrating good practices across nine dimensions:
- Decarbonization
- Climate resilience
- Water and land management
- Pollution reduction
- Conserving biodiversity
- Responsible sourcing of materials
- Improving quality of life
- Disaster preparedness
- Fostering inclusive growth
This 2025 edition builds on earlier work to provide a comprehensive resource for guiding the planning, development, construction, and management of greener, more sustainable roads.
Background
Indicator - Dimension Matrix

Spanning nearly 274,000 kilometers, Pakistan's road network functions as the country's circulatory system, yet it remains critically exposed to both the changing climate and the inefficiencies of legacy infrastructure planning. While the network supports a population of over 251 million, its composition is lopsided: 82% consists of local and rural roads, while high-capacity motorways and highways comprise just 7%. This infrastructure density—355 meters per square kilometer—struggles to keep pace with demographic pressures, evidenced by road availability dropping from 1.6 kilometers per thousand people in 2000 to 1.1 in 2024.
The composition of traffic flowing through these arteries offers a distinct decarbonization challenge compared to the Asia-Pacific average. Pakistan's fleet is overwhelmingly dominated by two-wheelers, which account for 60% of road users, while passenger cars and light duty vehicles (LDVs) make up only 13%. Consequently, motorization rates remain low at 156 vehicles per thousand people—roughly half the Asia-Pacific average of 317. Despite this, the sector is carbon-heavy. Road transport accounted for 46.9 million tonnes of CO₂ equivalent in 2024, representing 96% of total transport emissions. While the emissions intensity per unit of GDP has improved to 30 gCO₂e/USD, outperforming the regional average, the absolute growth of 2.6% per year since 2000 signals a need for urgent decoupling of mobility from carbon output.
The cost of this fossil-fuel dependence is not merely atmospheric but fiscally draining. Between 2016 and 2023, fossil fuel subsidies in the transport sector expanded to $7.8 billion USD. These subsidies effectively underwrite negative externalities: 72% of the societal cost manifests as road crashes, with congestion and road damage accounting for the remainder. The human toll is severe, with the World Health Organization estimating over 27,500 road crash fatalities in 2021 alone. Current reduction rates of 2% annually fall woefully short of the 7.4% required to halve fatalities by 2030. Furthermore, tailpipe emissions contribute heavily to the air quality crisis, causing at least 9,300 premature deaths annually and incurring health damages valued by the World Bank at nearly 9% of GDP.
Transitioning to ‘Green Roads' in Pakistan requires addressing the physical vulnerability of the infrastructure itself. The network faces potential average annual losses of nearly $219 million USD due to climate hazards, primarily flooding. Under a 4.5°C warming scenario, over 4% of road and rail assets would be exposed to extreme precipitation events. Bridges and tunnels are disproportionately at risk, shouldering nearly 5% of loss expectations despite constituting only 0.3% of the infrastructure stock. Resilience is therefore not a luxury but an economic imperative; current maintenance and expansion consume 36 million tonnes of material annually, embodying significant carbon emissions that further complicate the net-zero equation.
True sustainability also demands inclusivity. The current model leaves 43 million rural residents—an economically vital demographic—beyond the reach of all-season roads, severing their access to healthcare, education, and markets. Urban accessibility is similarly fractured; in 69% of cities, only two out of ten residents have access to public transport within a reasonable walking distance. This isolation is compounded by a stark gender gap, with women comprising a negligible 0.6% of the transport workforce.
Electrification offers a tangible pathway forward, provided it is coupled with grid decarbonization. Pakistan's grid emission factor of 398 gCO₂ per kWh is already cleaner than the Central and West Asia average, and EV imports have captured 7% of the market as of 2024. However, the heavy lifting remains in policy alignment. UNEP's E-mobility Readiness Index scores Pakistan at 76/100, showing promise in technology but lagging in policy frameworks.
To safeguard Pakistan's developmental future, the definition of road infrastructure must evolve. Success can no longer be measured solely by kilometers of road, but by the resilience of those assets to extreme weather, the reduction of the $94.3 billion annual air pollution bill, and the integration of the 43 million rural citizens currently cut off from the economy.
Decarbonization
Climate Resilience
Water and Land Management
Reducing Pollution
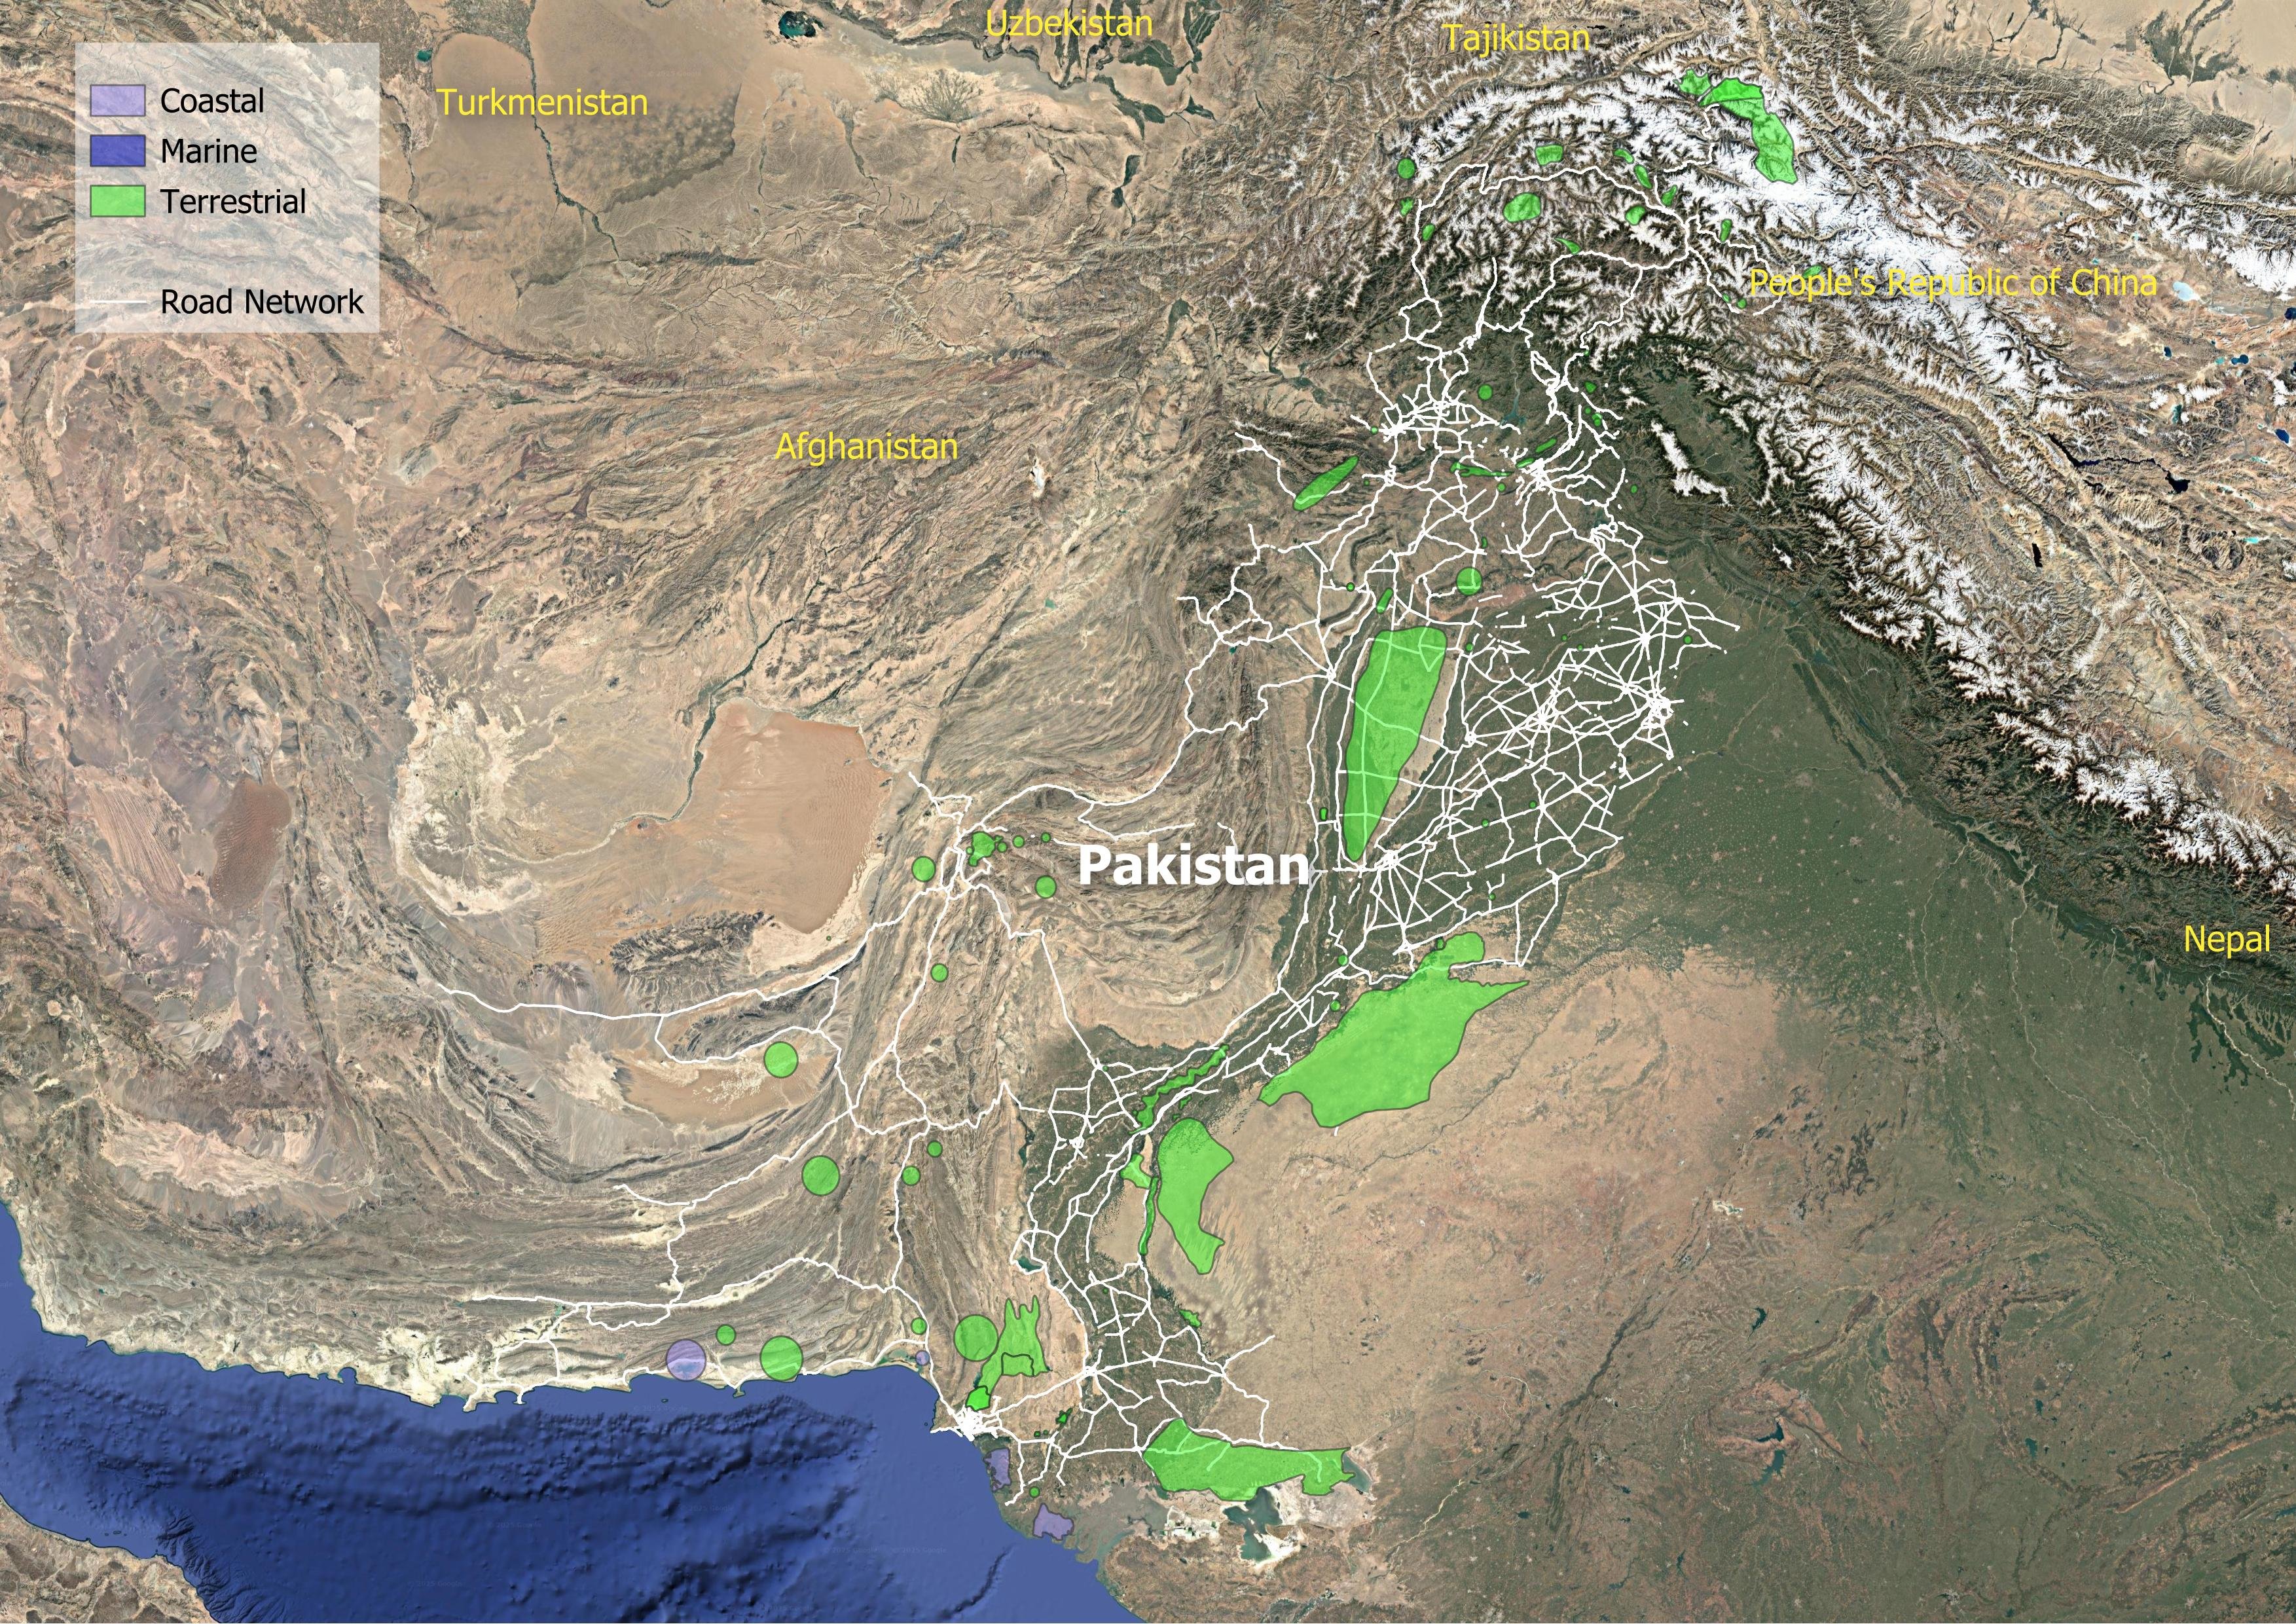
Preserving Biodiversity
Sustainable Materials Sourcing and Construction Practices
Improving Quality of life
Disaster Preparedness
Fostering Inclusive Growth
Supporting Information
Road Infrastructure Pipeline
| Central Asia Regional Economic Cooperation Corridor Development Investment Program | 2017 | 925 million USD | None |
| Central Asia Regional Economic Cooperation Corridor Development Investment Program (Tranche 2) | 2021 | 270.83 million USD | None |
| Central Asia Regional Economic Cooperation Corridor Development Investment Program (Tranche 3) | 2023 | 471.9 million USD | None |
| Central Asia Regional Economic Cooperation Corridor Development Investment Program-Tranche 1 | 2017 | 135 million USD | None |
| Karachi Freight Traffic Segregation Project | 2020 | None | None |
| Khyber Pakhtunkhwa Provincial Roads Improvement Project | 2017 | 249 million USD | None |
| Khyber Pakhtunkhwa Rural Roads Development Project | 2024 | 370 million USD | None |
| Mehran Highway Reconstruction for Port Qasim Access | 2020 | None | None |
| Pakistan: Reconstruction of National Highway N-5 under Pakistan’s Resilient Recovery, Rehabilitation and Reconstruction Framework Project – Phase 1A (the “Project”) | - | None | None |
| SAPT Access Road Rehabilitation Project | 2020 | None | None |
Road User Charging
| Actual maintenance budget | 1,572 |
| Required maintenance budget | 3,472 |
| Maintenance budget deficit | 1,900 |
| Fuel levy | 2,678 |
| Fuel excise duty | 35 |
| Fuel customs duty | 1,115 |
| Fuel sales tax | 1,762 |
| Vehicle excise duty | 95 |
| Vehicle customs duty | 394 |
| Vehicle sales tax | 339 |
| Provincial motor vehicle taxes | 162 |
| Tolling | 198 |
| Traffic fines | 17 |
| Right-of-way fee | 12 |
Unit Cost Road Projects
Road Transport Policy Landscape
Road Transport Policy Targets
| Pakistan 2025 | 2025 | raise road-density to a level of 0.45 km/sq.km, which will increase the existing road national network from around 260,000 km to 358,000 km |
| National Road Safety Strategy 2018-2030 | 2030 | By 2030, all new national and provincial highway construction or improvements achieve technical standards for all road users that take into account road safety, or, alternatively meet a 3-star rating or better By 2030 all new or rehabilitation (improvement) road designs should always have a higher safety rating than the existing road and have at least a 3-star rating standard for all road users By 2030, all new national and provincial highway construction or improvements achieve technical standards for all road users that take into account road safety, or, alternatively meet a 3-star rating or better By 2030 all new or rehabilitation (improvement) road designs should always have a higher safety rating than the existing road and have at least a 3-star rating standard for all road users By 2030 national highways with more than 50,000 vehicles per day to have a minimum of three stars for all users By 2030 sections of national highway network passing through linear settlements to have a minimum four-star standard for motorcyclists, pedestrians and bicyclists |
| National Road Safety Strategy 2018-2030 | 2030 | By 2030, more than 75 percent of travel on existing national highway network is on roads that meet technical standards for all road users which take into account road safety. |
Road Transport Policy Measure Types
References
AIIB. (n.d.). MEASURING TRANSPORT CONNECTIVITY FOR TRADE IN ASIA. https://impact.economist.com/perspectives/sites/default/files/eco141_aiib_transport_connectivity_4.pdf/
Asian Transport Observatory. (2025). Asia and the Pacific's Transport Infrastructure and Investment Outlook 2035. https://asiantransportobservatory.org/analytical-outputs/asia-transport-infrastructure-investment-needs/
Barrington-Leigh, C., & Millard-Ball, A. (2025). A high-resolution global time series of street-network sprawl. https://journals.sagepub.com/doi/10.1177/23998083241306829
CDRI. (2023). Global Infrastructure Risk Model and Resilience Index. https://giri.unepgrid.ch/
CIESIN. (2023a). Rural Access Index [Dataset]. https://sedac.ciesin.columbia.edu/data/set/sdgi-9-1-1-rai-2023
CIESIN. (2023b). SDG Indicator 11.2.1: Urban Access to Public Transport, 2023 Release: Sustainable Development Goal Indicators (SDGI). https://sedac.ciesin.columbia.edu/data/set/sdgi-11-2-1-urban-access-public-transport-2023
EDGAR. (2025). GHG emissions of all world countries: 2025. Publications Office. https://data.europa.eu/doi/10.2760/9816914
Ember. (2024). Electricity Data Explorer [Dataset]. https://ember-energy.org/data/electricity-data-explorer
EM-DAT. (2025). EM-DAT - The international disaster database. https://www.emdat.be/European Commission. (2024). Global Air Pollutant Emissions EDGAR v8.1 [Dataset]. https://edgar.jrc.ec.europa.eu/dataset_ap61#sources
IEA. (n.d.). Fossil Fuel Subsidies. IEA. Retrieved April 19, 2025, from https://www.iea.org/topics/fossil-fuel-subsidies
ILO. (2025). ILOSTAT [Dataset]. https://rplumber.ilo.org/files/website/bulk/indicator.html
ITDP. (2024). The Atlas of Sustainable City Transport. https://atlas.itdp.org/
Koks, E., Rozenberg, J., Tariverdi, M., Dickens, B., Fox, C., Ginkel, K. van, & Hallegatte, S. (2023). A global assessment of national road network vulnerability. Environmental Research: Infrastructure and Sustainability, 3(2), 025008. https://doi.org/10.1088/2634-4505/acd1aa
Liu, K., Wang, Q., Wang, M., & Koks, E. E. (2023). Global transportation infrastructure exposure to the change of precipitation in a warmer world. Nature Communications, 14(1), 2541. https://doi.org/10.1038/s41467-023-38203-3
McDuffie, E. E., Martin, R. V., Spadaro, J. V., Burnett, R., Smith, S. J., O'Rourke, P., Hammer, M. S., van Donkelaar, A., Bindle, L., Shah, V., Jaeglé, L., Luo, G., Yu, F., Adeniran, J. A., Lin, J., & Brauer, M. (2021). Source sector and fuel contributions to ambient PM2.5 and attributable mortality across multiple spatial scales. Nature Communications, 12(1), 3594. https://doi.org/10.1038/s41467-021-23853-y
Parry, S. B., Antung A. Liu,Ian W. H. (2023). IMF Fossil Fuel Subsidies Data: 2023 Update. IMF. https://www.imf.org/en/publications/wp/issues/2023/08/22/imf-fossil-fuel-subsidies-data-2023-update-537281
Simkins, A. T., Beresford, A. E., Buchanan, G. M., Crowe, O., Elliott, W., Izquierdo, P., Patterson, D. J., & Butchart, S. H. M. (2023). A global assessment of the prevalence of current and potential future infrastructure in Key Biodiversity Areas. Biological Conservation, 281, 109953. https://doi.org/10.1016/j.biocon.2023.109953
Sims, M., Stanimirova, R., Neumann, M., Raichuk, A., & Purves, D. (2025). New Data Shows What's Driving Forest Loss Around the World. https://www.wri.org/insights/forest-loss-drivers-data-trends
Trademap. (2025). Trade Map. Trade Map. https://www.trademap.org/Index.aspx
UN DESA. (n.d.). Economic and Environmental Vulnerability Indicators. Retrieved January 26, 2026, from https://policy.desa.un.org/themes/least-developed-countries-category/ldc-identification-criteria-indicators/evi-indicators
UN DESA. (2025). 2024 Revision of World Population Prospects. https://population.un.org/wpp/
UN Energy Statistics. (2025). Energy Balance Visualization [Dataset]. https://unstats.un.org/unsd/energystats/dataPortal/
UNEP. (2021, May 12). Domestic material consumption (DMC) and DMC per capita, per GDP (Tier I). https://www.unep.org/indicator-1222
Weiss, D. J., Nelson, A., Gibson, H. S., Temperley, W., Peedell, S., Lieber, A., Hancher, M., Poyart, E., Belchior, S., Fullman, N., Mappin, B., Dalrymple, U., Rozier, J., Lucas, T. C. D., Howes, R. E., Tusting, L. S., Kang, S. Y., Cameron, E., Bisanzio, D., … Gething, P. W. (2018). A global map of travel time to cities to assess inequalities in accessibility in 2015. Nature, 553(7688), 333-336. https://doi.org/10.1038/nature25181
WHO. (2023). Global Status Report on Road Safety 2023. https://www.who.int/teams/social-determinants-of-health/safety-and-mobility/global-status-report-on-road-safety-2023
Wiedenhofer, D., Baumgart, A., Matej, S., Virág, D., Kalt, G., Lanau, M., Tingley, D. D., Liu, Z., Guo, J., Tanikawa, H., & Haberl, H. (2024). Mapping and modelling global mobility infrastructure stocks, material flows and their embodied greenhouse gas emissions [Dataset]. https://doi.org/10.1016/j.jclepro.2023.139742
World Bank. (2021). ICP 2021. https://databank.worldbank.org/source/icp-2021
World Bank. (2022a). Annual freshwater withdrawals, total (% of internal resources) [Dataset]. https://data.worldbank.org
World Bank. (2022b). Land area (sq. Km) [Dataset]. https://data.worldbank.org
World Bank. (2022c). The Global Health Cost of PM2.5 Air Pollution: A Case for Action Beyond 2021. The World Bank. https://doi.org/10.1596/978-1-4648-1816-5
World Bank. (2023). Forest area (% of land area) [Dataset]. https://data.worldbank.org/indicator/AG.LND.FRST.ZS
World Bank. (2024). Home | Logistics Performance Index (LPI). Logistics Performance Index. https://lpi.worldbank.org/
World Bank. (2025a). GDP per capita, PPP (current international $) [Dataset]. https://data.worldbank.org/indicator/NY.GDP.PCAP.PP.CD
World Bank. (2025b). GDP, PPP (current international $) [Dataset]. https://data.worldbank.org/indicator/NY.GDP.MKTP.PP.CD
World Database on Protected Areas. (2024). Protected Areas (WDPA) [Dataset]. https://www.protectedplanet.net/en/thematic-areas/wdpa?tab=WDPA