
Nepal Green Roads Profile 2025
NEPAL
GREEN ROADS PROFILESupported by:
The ATO green roads profiles present country-level perspectives on how 35 Asia-Pacific economies are addressing the development and management of sustainable eco-friendly roads. Drawing from diverse datasets and policy documents, the profiles highlight practices and measures that contribute to greener transport infrastructure.
Developed by the Asian Transport Observatory (ATO) in partnership with the International Road Federation (IRF), the profiles are designed to complement the Green Roads Toolkit. The toolkit provides a practical reference for integrating good practices across nine dimensions:
- Decarbonization
- Climate resilience
- Water and land management
- Pollution reduction
- Conserving biodiversity
- Responsible sourcing of materials
- Improving quality of life
- Disaster preparedness
- Fostering inclusive growth
This 2025 edition builds on earlier work to provide a comprehensive resource for guiding the planning, development, construction, and management of greener, more sustainable roads.
Background
Indicator - Dimension Matrix

Nepal's road network has expanded significantly over the last two decades, evolving from a mechanism of basic connectivity to a complex driver of both economic integration and environmental strain. Between 2000 and 2024, road availability more than doubled, rising from 1.5 to 3.9 kilometers per thousand population. The physical footprint now spans 115.3 thousand kilometers, a system overwhelmingly dominated by local and rural roads, which account for 94% of the infrastructure stock. Yet, this connectivity dividend has been accompanied by a disproportionate escalation in emissions. While economy-wide greenhouse gas (GHG) emissions grew at a modest 1.5% annually since 2000, road transport emissions increased by 7.7% per year over the same period. By 2024, the sector reached 5.0 million tonnes of CO2e—representing 98% of total transport emissions—indicating that the decoupling of mobility demand from carbon output remains elusive.
The intensity of these emissions reveals structural inefficiencies. Nepal's road transport emissions intensity stood at 30 grams of CO2e per USD of GDP in 2024, notably higher than the Asia-Pacific average of 26 and the South Asian average of 19. This trajectory is driven by a fleet composition where Light Duty Vehicles (LDVs) constitute 58% of network users, followed by two-wheelers at 22%. However, a rapid market shift is underway, signaling a potent opportunity for decarbonization.
Between 2015 and 2024, the value of Electric Vehicle (EV) imports totalled 610 million USD. In 2024 alone, EVs captured an unprecedented 53% share of total road vehicle imports, primarily driven by LDVs. This market dynamism is reflected in UNEP's E-mobility Readiness Index, where Nepal scores 70 out of 100, though policy and financial readiness lag behind market adoption.
Beyond carbon, the external costs of the current transport model weigh heavily on the national economy and public health. The World Bank estimates the annual cost of health damages from PM 2.5 exposure amounted to 10.4 billion USD in 2019, equivalent to roughly 10% of GDP. The concentration of PM 2.5 reached 81.4 micrograms per cubic meter, resulting in at least 1,100 premature deaths attributed to tailpipe emissions. Concurrently, road safety indicators remain alarming. The World Health Organization estimated 8,479 fatalities in 2021.The economic burden of road crashes in Nepal is substantial. Fatalities and serious injuries cost an estimated 3 billion USD in 2021, equivalent to roughly 7% of Nepal's GDP. This surpasses the country's healthcare expenditure of 5.4% of GDP in the same year. The quality of road infrastructure plays a crucial role in road safety. As of 2024, only 17% and 32% of Nepal's roads have a 3-star or better IRAP rating for pedestrians and bicyclists, respectively. While these figures are comparable to the Asia-Pacific averages, there's still significant room for improvement. For vehicle occupants, at least 35% of the road infrastructure has a 3-star or better rating, while only 27% achieve this rating for motorcyclists, highlighting a disparity in safety standards for different road user groups. Nepal had high fatality rate per road infrastructure, about 78 fatalities per thousand kilometers of road.
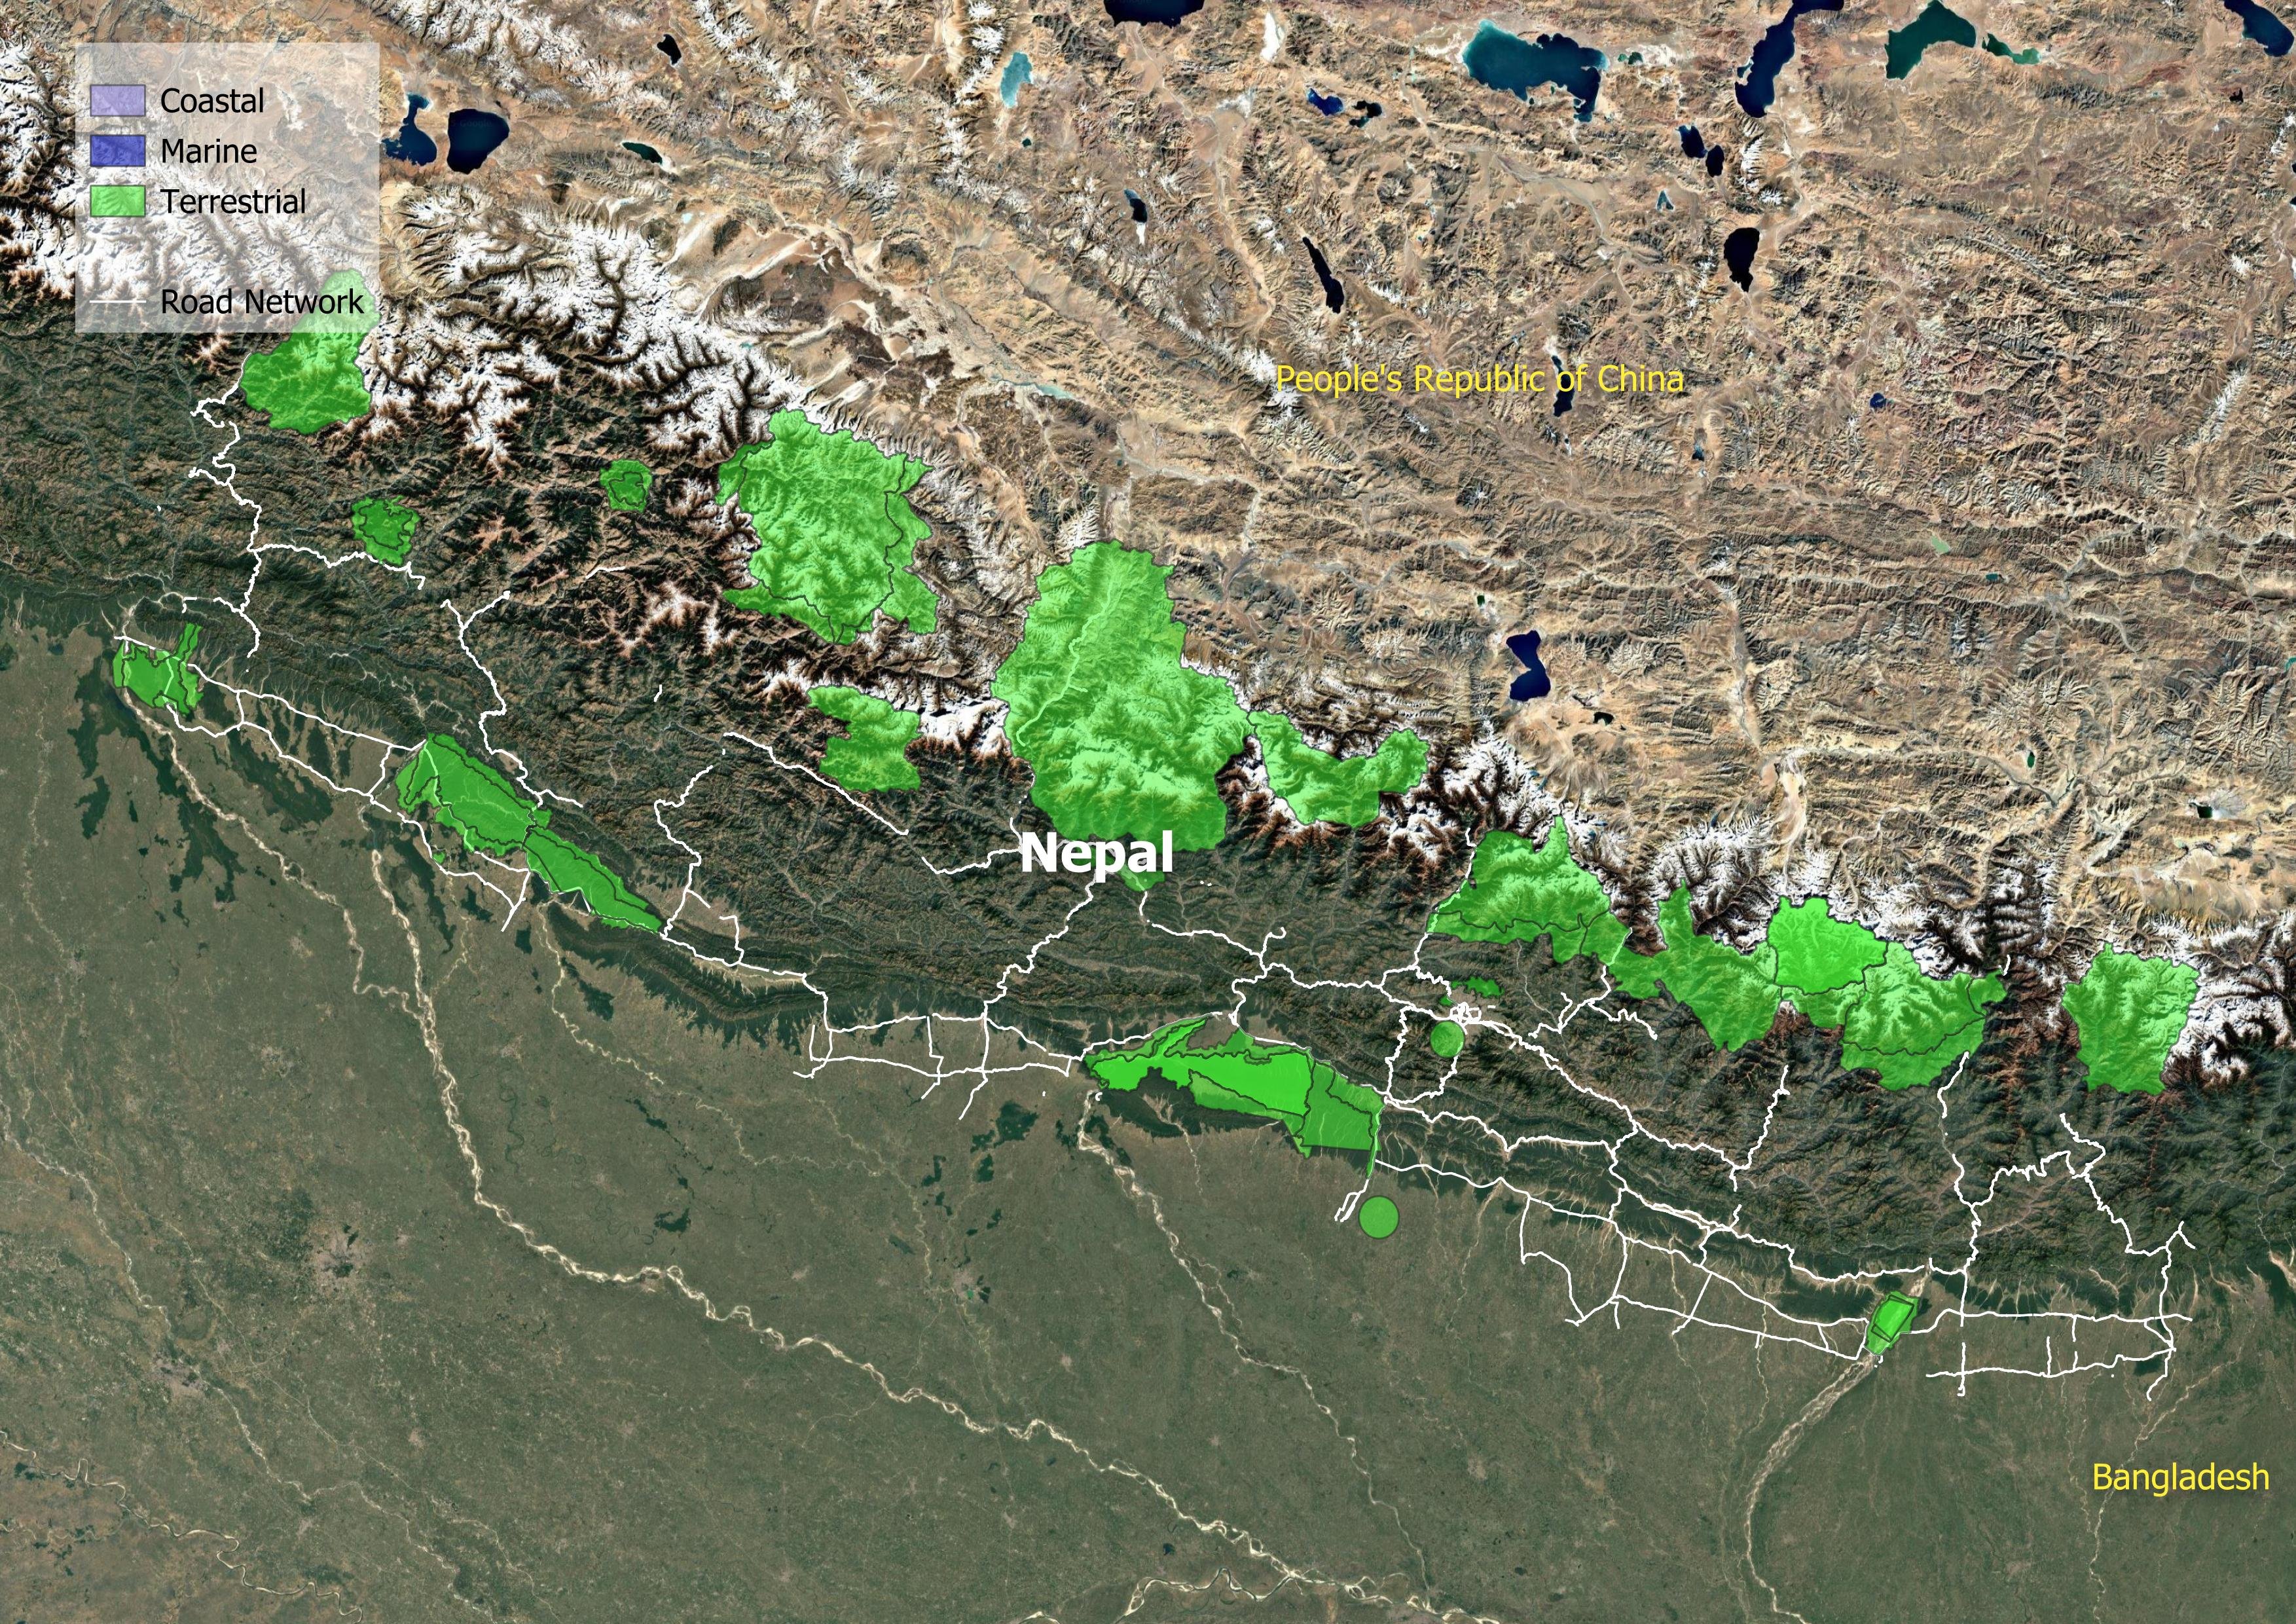
Infrastructure resilience poses a parallel challenge in this geologically fragile region. Under a 4.5-degree warming scenario, over 34% of Nepal's road assets face exposure to frequent and extreme precipitation. The financial implications are immediate: the country faces average annual losses of 13.9 million USD to transport infrastructure, with bridges and tunnels bearing a disproportionate share of the risk relative to their network length. Furthermore, expansion has encroached upon ecological integrity; 25 of Nepal's 30 Key Biodiversity Areas (KBAs) now contain road infrastructure, with a density of 86 meters per thousand square kilometers within these protected zones.
Despite the expanded network, equity gaps persist. Approximately 1.9 million rural residents remain beyond the reach of all-season roads, isolating them from essential services and markets. In urban centers, public transport accessibility is starkly limited, with only 20% of residents in major agglomerations having convenient access.
The transition to green roads in Nepal requires a simultaneous address of decarbonization, climate resilience, and equitable access. While the rapid uptake of electric propulsion in the import market demonstrates strong consumer readiness, the systemic inefficiency of the sector—measured by high emissions intensity and severe health costs—demands rigorous policy intervention. Future investment strategies must prioritize the hardening of infrastructure against extreme precipitation while curbing the encroachment on biodiversity.
Decarbonization
Climate Resilience
Water and Land Management
Reducing Pollution
Preserving Biodiversity
Sustainable Materials Sourcing and Construction Practices
Improving Quality of life
Disaster Preparedness
Fostering Inclusive Growth
Supporting Information
Road Infrastructure Pipeline
| Kathmandu–Kulekhani–Hetauda Tunnel Highway (KKHT) | 2012 | 375 million USD | 58 |
| Kathmandu–Terai Fast Track (KTFT) | 2017 | 21193 million NPR | 70.98 |
| Nagdhunga Tunnel Construction Project | 2016 | None | None |
| Nepal Strategic Road Connectivity and Trade Improvement Project | 2020 | 801.50003 million USD | None |
| Provincial and Local Roads Improvement Program - Phase 1 | 2024 | 120 million USD | None |
| South Asia Subregional Economic Cooperation Highway Enhancement Project (Kakarbhitta-Laukahi) | 2023 | 363.22 million USD | None |
| South Asia Subregional Economic Cooperation Highway Improvement Project | 2018 | 257.15 million USD | None |
| South Asia Subregional Economic Cooperation Mugling–Pokhara Highway Improvement Phase 1 Project | 2019 | 254.5 million USD | None |
| South Asia Subregional Economic Cooperation Roads Improvement Project | 2016 | 256.5 million USD | 160 |
| Third Bridges Improvement and Maintenance Program | 2025 | None | None |
Road User Charging
| Actual maintenance budget | 87 |
| Required maintenance budget | 290 |
| Maintenance budget deficit | 203 |
| Fuel tax | 42.4 |
| Vehicle registration tax | 365.5 |
| Tolls | 2 |
| Vehicle customs duty | 185.4 |
| Vehicle excise duty | 149.7 |
Unit Cost Road Projects
Road Transport Policy Landscape
Road Transport Policy Targets
| The Fifteenth Plan (Fiscal Year 2019/20 - 2023/24) | 2024 | Road density = 0.74 km/sqkm (baseline = 0.55 (2018/19)) National and provincial highways (up to 2 lanes) (*Only blacktopped roads) = 20,200 km (baseline = 7,794 (2018/19)) National highways (above 2 lanes, including fast tracks) = 1174 km (baseline = 96 (2018/19)) Railways = 348 km (baseline = 42 (2018/19)) |
| The Fifteenth Plan (Fiscal Year 2019/20 - 2023/24) | 2024 | Transportation, storage and communication Gross Domestic Product and sector-wise value addition target (In 10 million rupees) = 37,122 (baseline 2018/19 = 22,135) Economic growth rate and sector-wise value addition target = 10.8% (baseline 2018/19 = 5.9%) Sector-wise contribution to the gross domestic product = 7.7% (baseline 2018/19 = 7.2%) Incremental capital-output ratio and total investment (At the constant prices of FY 2018/19) (In 10 million rupees) = 45740 |
| The Fifteenth Plan (Fiscal Year 2019/20 - 2023/24) | 2024 | Families with access to transportation within the distance of 30 minutes = 95 (baseline = 82 (2018/19)) |
Road Transport Policy Measure Types
References
AIIB. (n.d.). MEASURING TRANSPORT CONNECTIVITY FOR TRADE IN ASIA. https://impact.economist.com/perspectives/sites/default/files/eco141_aiib_transport_connectivity_4.pdf/
Asian Transport Observatory. (2025). Asia and the Pacific's Transport Infrastructure and Investment Outlook 2035. https://asiantransportobservatory.org/analytical-outputs/asia-transport-infrastructure-investment-needs/
Barrington-Leigh, C., & Millard-Ball, A. (2025). A high-resolution global time series of street-network sprawl. https://journals.sagepub.com/doi/10.1177/23998083241306829
CDRI. (2023). Global Infrastructure Risk Model and Resilience Index. https://giri.unepgrid.ch/
CIESIN. (2023a). Rural Access Index [Dataset]. https://sedac.ciesin.columbia.edu/data/set/sdgi-9-1-1-rai-2023
CIESIN. (2023b). SDG Indicator 11.2.1: Urban Access to Public Transport, 2023 Release: Sustainable Development Goal Indicators (SDGI). https://sedac.ciesin.columbia.edu/data/set/sdgi-11-2-1-urban-access-public-transport-2023
EDGAR. (2025). GHG emissions of all world countries: 2025. Publications Office. https://data.europa.eu/doi/10.2760/9816914
Ember. (2024). Electricity Data Explorer [Dataset]. https://ember-energy.org/data/electricity-data-explorer
EM-DAT. (2025). EM-DAT - The international disaster database. https://www.emdat.be/European Commission. (2024). Global Air Pollutant Emissions EDGAR v8.1 [Dataset]. https://edgar.jrc.ec.europa.eu/dataset_ap61#sources
IEA. (n.d.). Fossil Fuel Subsidies. IEA. Retrieved April 19, 2025, from https://www.iea.org/topics/fossil-fuel-subsidies
ILO. (2025). ILOSTAT [Dataset]. https://rplumber.ilo.org/files/website/bulk/indicator.html
ITDP. (2024). The Atlas of Sustainable City Transport. https://atlas.itdp.org/
Koks, E., Rozenberg, J., Tariverdi, M., Dickens, B., Fox, C., Ginkel, K. van, & Hallegatte, S. (2023). A global assessment of national road network vulnerability. Environmental Research: Infrastructure and Sustainability, 3(2), 025008. https://doi.org/10.1088/2634-4505/acd1aa
Liu, K., Wang, Q., Wang, M., & Koks, E. E. (2023). Global transportation infrastructure exposure to the change of precipitation in a warmer world. Nature Communications, 14(1), 2541. https://doi.org/10.1038/s41467-023-38203-3
McDuffie, E. E., Martin, R. V., Spadaro, J. V., Burnett, R., Smith, S. J., O'Rourke, P., Hammer, M. S., van Donkelaar, A., Bindle, L., Shah, V., Jaeglé, L., Luo, G., Yu, F., Adeniran, J. A., Lin, J., & Brauer, M. (2021). Source sector and fuel contributions to ambient PM2.5 and attributable mortality across multiple spatial scales. Nature Communications, 12(1), 3594. https://doi.org/10.1038/s41467-021-23853-y
Parry, S. B., Antung A. Liu,Ian W. H. (2023). IMF Fossil Fuel Subsidies Data: 2023 Update. IMF. https://www.imf.org/en/publications/wp/issues/2023/08/22/imf-fossil-fuel-subsidies-data-2023-update-537281
Simkins, A. T., Beresford, A. E., Buchanan, G. M., Crowe, O., Elliott, W., Izquierdo, P., Patterson, D. J., & Butchart, S. H. M. (2023). A global assessment of the prevalence of current and potential future infrastructure in Key Biodiversity Areas. Biological Conservation, 281, 109953. https://doi.org/10.1016/j.biocon.2023.109953
Sims, M., Stanimirova, R., Neumann, M., Raichuk, A., & Purves, D. (2025). New Data Shows What's Driving Forest Loss Around the World. https://www.wri.org/insights/forest-loss-drivers-data-trends
Trademap. (2025). Trade Map. Trade Map. https://www.trademap.org/Index.aspx
UN DESA. (n.d.). Economic and Environmental Vulnerability Indicators. Retrieved January 26, 2026, from https://policy.desa.un.org/themes/least-developed-countries-category/ldc-identification-criteria-indicators/evi-indicators
UN DESA. (2025). 2024 Revision of World Population Prospects. https://population.un.org/wpp/
UN Energy Statistics. (2025). Energy Balance Visualization [Dataset]. https://unstats.un.org/unsd/energystats/dataPortal/
UNEP. (2021, May 12). Domestic material consumption (DMC) and DMC per capita, per GDP (Tier I). https://www.unep.org/indicator-1222
Weiss, D. J., Nelson, A., Gibson, H. S., Temperley, W., Peedell, S., Lieber, A., Hancher, M., Poyart, E., Belchior, S., Fullman, N., Mappin, B., Dalrymple, U., Rozier, J., Lucas, T. C. D., Howes, R. E., Tusting, L. S., Kang, S. Y., Cameron, E., Bisanzio, D., … Gething, P. W. (2018). A global map of travel time to cities to assess inequalities in accessibility in 2015. Nature, 553(7688), 333-336. https://doi.org/10.1038/nature25181
WHO. (2023). Global Status Report on Road Safety 2023. https://www.who.int/teams/social-determinants-of-health/safety-and-mobility/global-status-report-on-road-safety-2023
Wiedenhofer, D., Baumgart, A., Matej, S., Virág, D., Kalt, G., Lanau, M., Tingley, D. D., Liu, Z., Guo, J., Tanikawa, H., & Haberl, H. (2024). Mapping and modelling global mobility infrastructure stocks, material flows and their embodied greenhouse gas emissions [Dataset]. https://doi.org/10.1016/j.jclepro.2023.139742
World Bank. (2021). ICP 2021. https://databank.worldbank.org/source/icp-2021
World Bank. (2022a). Annual freshwater withdrawals, total (% of internal resources) [Dataset]. https://data.worldbank.org
World Bank. (2022b). Land area (sq. Km) [Dataset]. https://data.worldbank.org
World Bank. (2022c). The Global Health Cost of PM2.5 Air Pollution: A Case for Action Beyond 2021. The World Bank. https://doi.org/10.1596/978-1-4648-1816-5
World Bank. (2023). Forest area (% of land area) [Dataset]. https://data.worldbank.org/indicator/AG.LND.FRST.ZS
World Bank. (2024). Home | Logistics Performance Index (LPI). Logistics Performance Index. https://lpi.worldbank.org/
World Bank. (2025a). GDP per capita, PPP (current international $) [Dataset]. https://data.worldbank.org/indicator/NY.GDP.PCAP.PP.CD
World Bank. (2025b). GDP, PPP (current international $) [Dataset]. https://data.worldbank.org/indicator/NY.GDP.MKTP.PP.CD
World Database on Protected Areas. (2024). Protected Areas (WDPA) [Dataset]. https://www.protectedplanet.net/en/thematic-areas/wdpa?tab=WDPA