
Myanmar Green Roads Profile 2025
MYANMAR
GREEN ROADS PROFILESupported by:
The ATO green roads profiles present country-level perspectives on how 35 Asia-Pacific economies are addressing the development and management of sustainable eco-friendly roads. Drawing from diverse datasets and policy documents, the profiles highlight practices and measures that contribute to greener transport infrastructure.
Developed by the Asian Transport Observatory (ATO) in partnership with the International Road Federation (IRF), the profiles are designed to complement the Green Roads Toolkit. The toolkit provides a practical reference for integrating good practices across nine dimensions:
- Decarbonization
- Climate resilience
- Water and land management
- Pollution reduction
- Conserving biodiversity
- Responsible sourcing of materials
- Improving quality of life
- Disaster preparedness
- Fostering inclusive growth
This 2025 edition builds on earlier work to provide a comprehensive resource for guiding the planning, development, construction, and management of greener, more sustainable roads.
Background
Indicator - Dimension Matrix

Myanmar's mobility infrastructure is primarily characterized by small-scale local routes rather than major arteries. The country features a road network of 231,500 kilometers within a land area of 653,000 square kilometers, mostly comprising local and rural roads, which make up 89% of all roads. Only 3% are classified as motorways or primary highways. This predominance of minor roads influences Myanmar's approach to decarbonization. Although road infrastructure has increased slightly to 4.2 kilometers per thousand people, the overall density is still low at 355 meters per square kilometer. This sparse network presents logistical challenges, hindering the development of resilient, sustainable transport infrastructure.
The vehicular fleet navigating this network presents a distinct profile for emissions mitigation. Two-wheelers form the overwhelming majority at 85%, creating a motorization rate of 151 vehicles per thousand population—roughly half the Asia-Pacific average. Despite this relatively low vehicle ownership, the carbon intensity of the sector is accelerating disproportionately. While economy-wide emissions grew at a modest 1.3% annually since 2000, road transport emissions surged by 5.8% per year, culminating in 13.3 million tonnes of CO2e by 2024. This sector now accounts for 97% of total transport emissions, signaling that any "Green Road" initiative must prioritize the decarbonization of two-wheelers and the heavy-duty vehicles responsible for 32% of emissions, rather than focusing solely on private passenger cars.
Electrification has captured a foothold, evidenced by electric vehicles (EVs) comprising 31% of total road vehicle imports by 2024. However, the environmental dividend of this shift is blunted by the upstream power generation mix. The grid emission factor has regressed by 4.1% since 2015, sitting at 570g CO2 per kWh, notably higher than the Asia-Pacific average. Without concurrent grid decarbonization, the shift to electric mobility merely displaces emissions from the tailpipe to the smokestack. UNEP's E-mobility Readiness Index scores Myanmar at 54 out of 100, highlighting acute deficits in policy frameworks and financial mechanisms necessary to support a transition that is genuinely clean rather than superficially electric.
Climate resilience poses a fiscal and physical existential threat to the network. The Asian Infrastructure Investment Bank estimates network efficiency at a suboptimal 0.53, yet the greater danger lies in asset vulnerability. Under a 4.5-degree warming scenario, over 57% of road and rail assets face exposure to intensified precipitation. This climatic stress translates into economic loss; average annual losses to transport infrastructure are estimated at 55.6 million USD, with roads absorbing 72% of this damage. Bridges and tunnels, though only 0.2% of the infrastructure stock, shoulder a disproportionate 2.6% of losses. The current material stock of 952.5 million tonnes implies that maintenance and expansion require 20.5 million tonnes of material annually, carrying an embodied carbon weight of 909,000 tonnes CO2-equivalent. A green road strategy must therefore pivot toward material efficiency and adaptation to mitigate the projected financial shocks.
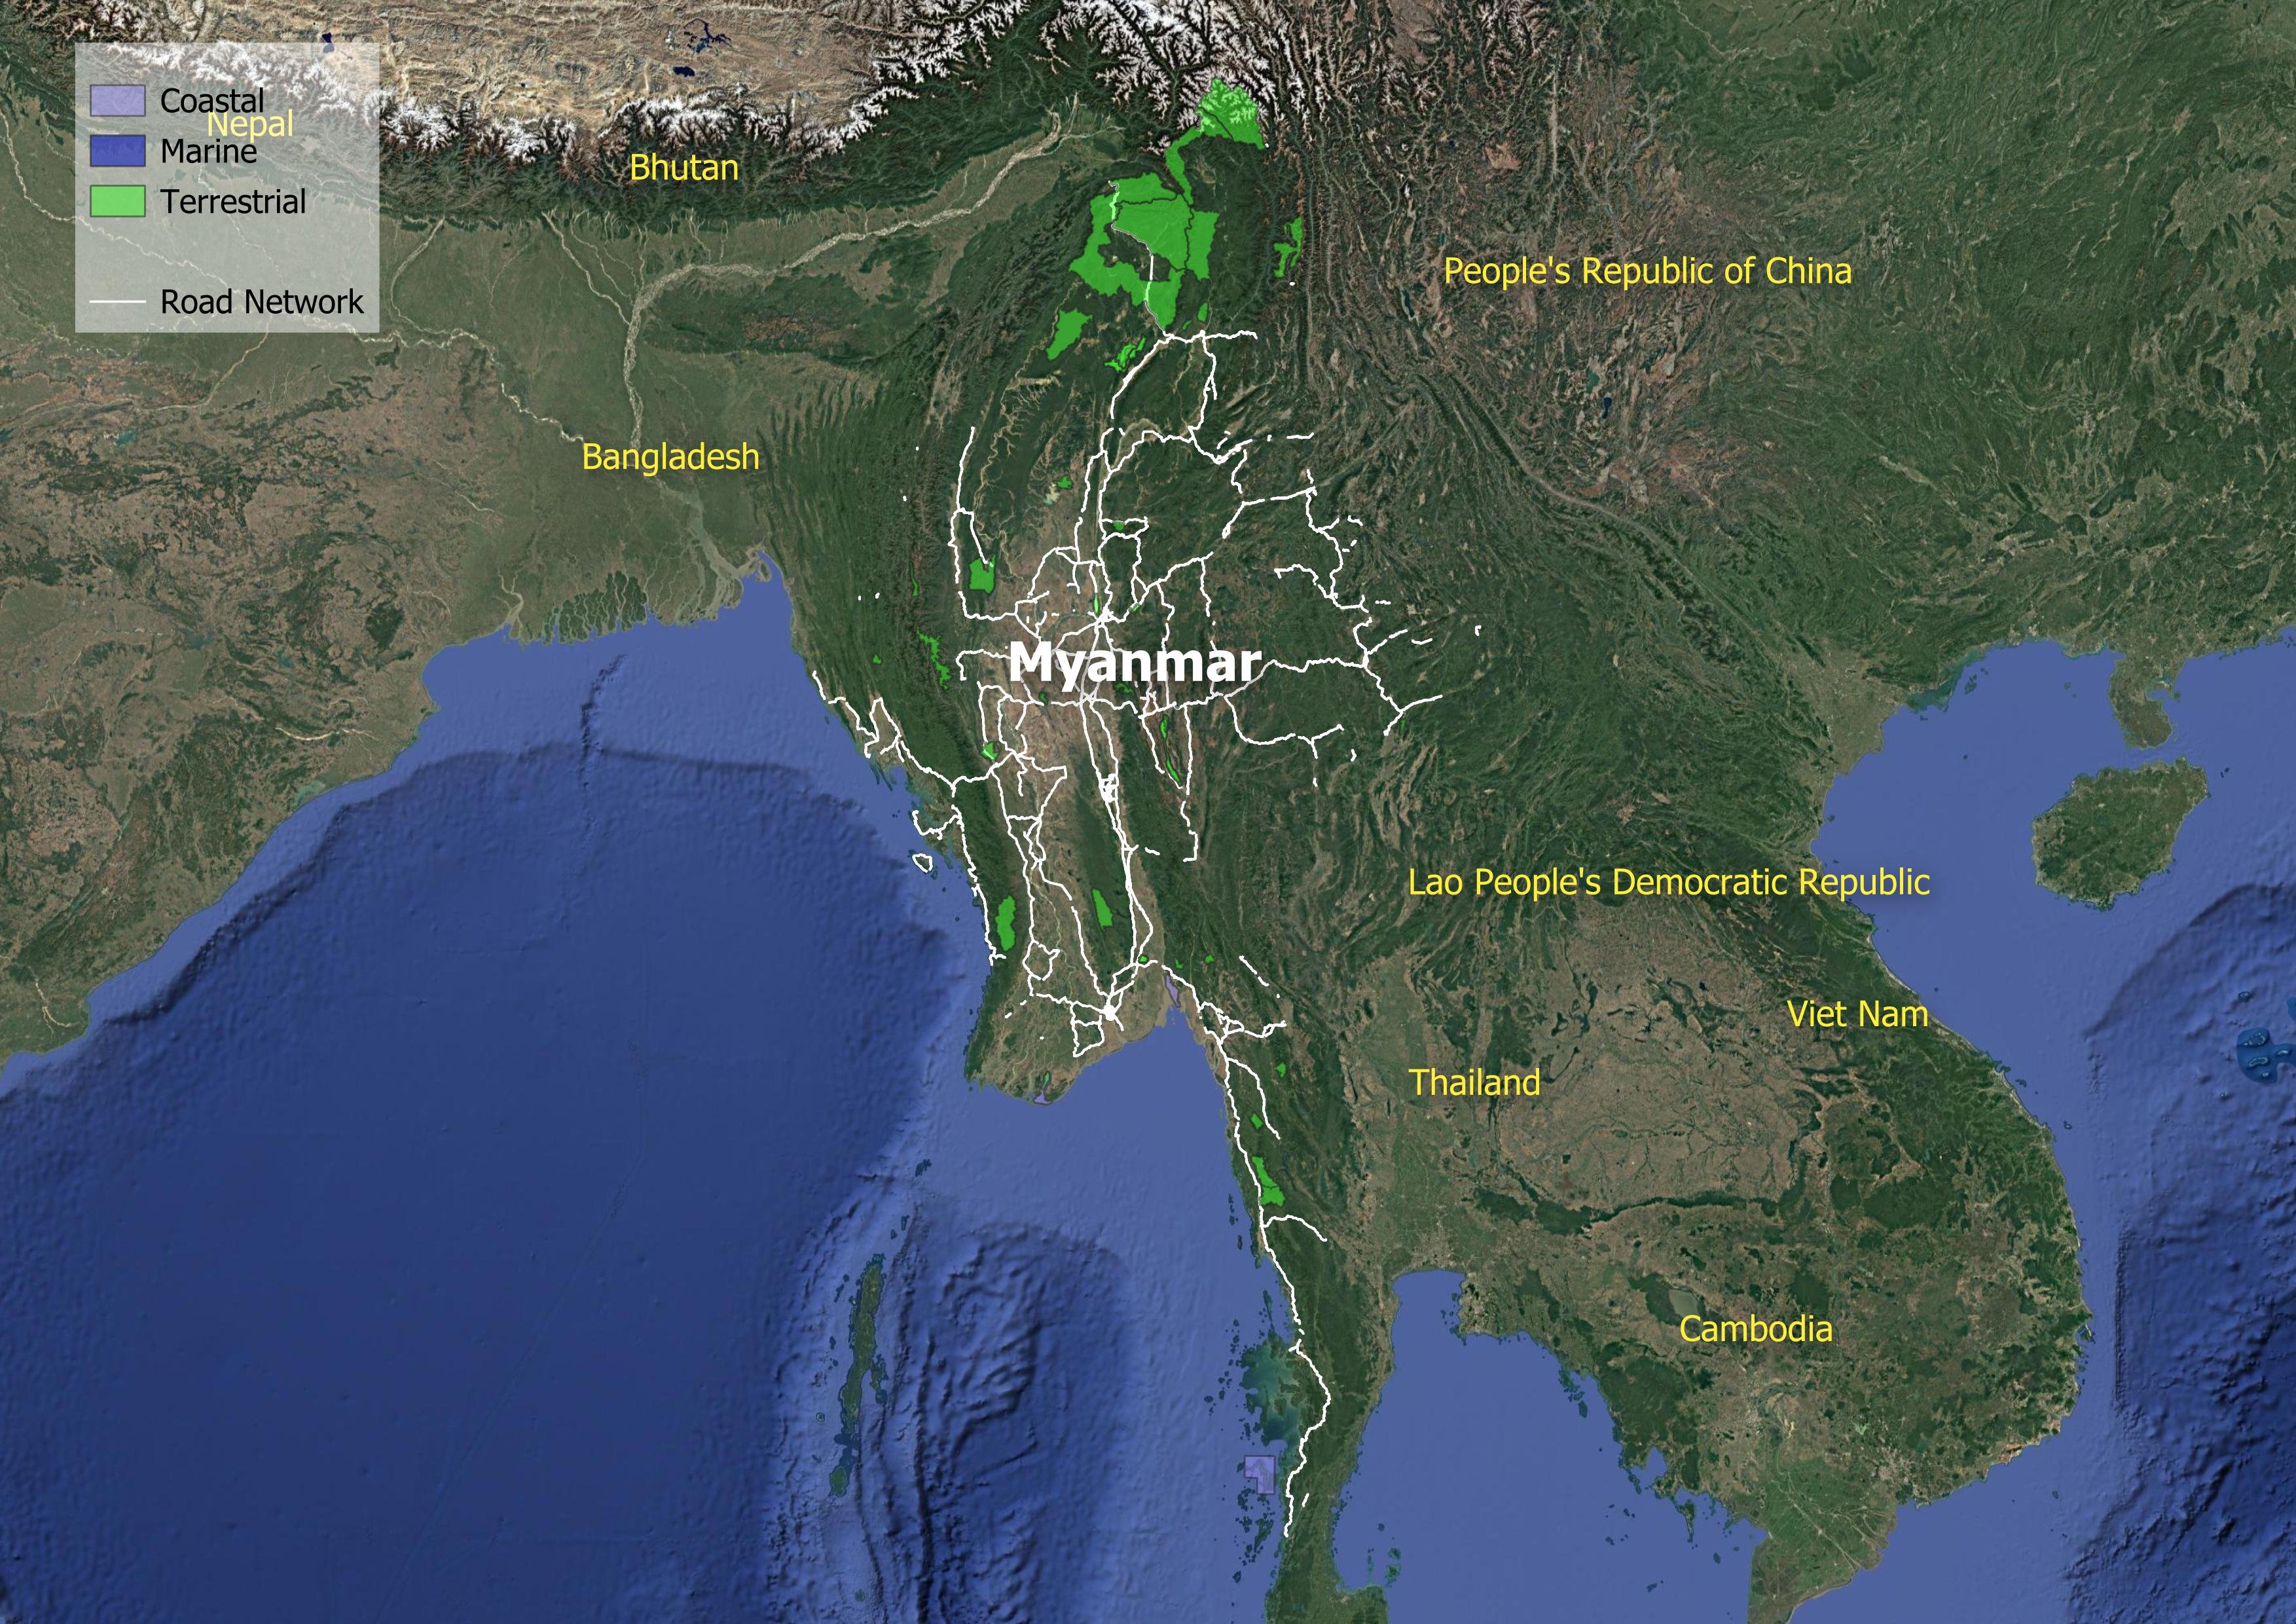
Ecological and social friction points further complicate the expansion of the network. Road infrastructure currently intrudes into 79 of Myanmar's 114 Key Biodiversity Areas, fragmenting habitats with a density of 22 meters per thousand square kilometers in these sensitive zones. Simultaneously, the network fails to deliver equitable access. A staggering 13.7 million rural residents live beyond two kilometers of an all-season road, effectively severing them from healthcare, markets, and disaster recovery mechanisms. In urban agglomerations, only 30% of the population enjoys public transport access levels of 50% or better. The safety deficit is equally stark, with road crash fatalities estimated at 10,405 in 2021.The economic burden of road crashes in Myanmar is substantial. Fatalities and serious injuries cost an estimated 3 billion USD in 2021, representing roughly 5% of Myanmar's GDP. This figure is comparable to the country's healthcare expenditure of 5.6% of GDP in the same year.
Transitioning Myanmar's transport sector requires a simultaneous calibration of infrastructure resilience, energy diversification, and social inclusion. The current trajectory—characterized by diverging emissions growth and a regressing grid factor—undermines the gains from early EV adoption. A "Green Road" framework for Myanmar could integrate biodiversity safeguards to protect the 114 key ecological zones while closing the access gap for the 13.7 million rural citizens currently isolated. Success depends on decoupling mobility growth from carbon intensity through a cleaner grid and robust adaptation investments to shield the 55.6 million USD in annual infrastructure value currently at risk from climate volatility.
Decarbonization
Climate Resilience
Water and Land Management
Reducing Pollution
Preserving Biodiversity
Sustainable Materials Sourcing and Construction Practices
Improving Quality of life
Disaster Preparedness
Fostering Inclusive Growth
Supporting Information
Road Infrastructure Pipeline
| Bago River Bridge Construction Project | 2017 | None | None |
| East-West Economic Corridor Highway Development Project | 2020 | None | None |
| Greater Mekong Subregion East–West Economic Corridor Eindu to Kawkareik Road Improvement Project | 2015 | 121.8 million USD | None |
| Greater Mekong Subregion Highway Modernization Project | 2018 | 202.1 million USD | 99 |
| Rural Roads and Access Project | 2019 | 52.41 million USD | 152 |
| Second Greater Mekong Subregion Highway Modernization Project | 2020 | 526.34 million USD | None |
Unit Cost Road Projects
Road Transport Policy Landscape
Road Transport Policy Targets
| The Survey Program for the National Transport Development Plan in the Republic of the Union of Myanmar | 2030 | Complete a total of 3,000 km of ASEAN Highway Network in Myanmar (e.g. AH-1: Yangon- Mandalay- Tamu, AH-2: Mandalay-Taunggyi-Tachileik) by the year 2030. |
| National Strategy for Rural Roads and Access | 2025 | The second priority for the Government of Myanmar will be villages with more than 500 people, with at least 95% of these villages to be connected by allseason road by 2025. |
| National Strategy for Rural Roads and Access | 2030 | The third priority for the Government of Myanmar will be to target villages with more than 250 people, connecting at least 75% of these villages by all-season roads by 2030. Villages with less than 250 people will also be included, with at least 50% of these villages connected by all-season road by 2030. The long-term development objective of the Government of Myanmar is to provide all-season access to all villages in Myanmar. In support of this long-term development objective, this National Strategy for Rural Roads and Access targets the next 15 years up to 2030, during which the Government of Myanmar aims to provide all-season road access to at least 80% of the villages in each state/region in Myanmar. By prioritizing the villages with larger populations, the Government of Myanmar will connect an additional 10 million rural people by all-season road, providing year-round road access to approximately 90% of the rural population in the country by 2030. The Government of Myanmar will furthermore provide dry-season road access to an additional 6,700 villages, ensuring that at least 90% of the villages in each state/region and up to 95% of the country’s rural population have some form of road access by 2030. |
Road Transport Policy Measure Types
References
AIIB. (n.d.). MEASURING TRANSPORT CONNECTIVITY FOR TRADE IN ASIA. https://impact.economist.com/perspectives/sites/default/files/eco141_aiib_transport_connectivity_4.pdf/
Asian Transport Observatory. (2025). Asia and the Pacific's Transport Infrastructure and Investment Outlook 2035. https://asiantransportobservatory.org/analytical-outputs/asia-transport-infrastructure-investment-needs/
Barrington-Leigh, C., & Millard-Ball, A. (2025). A high-resolution global time series of street-network sprawl. https://journals.sagepub.com/doi/10.1177/23998083241306829
CDRI. (2023). Global Infrastructure Risk Model and Resilience Index. https://giri.unepgrid.ch/
CIESIN. (2023a). Rural Access Index [Dataset]. https://sedac.ciesin.columbia.edu/data/set/sdgi-9-1-1-rai-2023
CIESIN. (2023b). SDG Indicator 11.2.1: Urban Access to Public Transport, 2023 Release: Sustainable Development Goal Indicators (SDGI). https://sedac.ciesin.columbia.edu/data/set/sdgi-11-2-1-urban-access-public-transport-2023
EDGAR. (2025). GHG emissions of all world countries: 2025. Publications Office. https://data.europa.eu/doi/10.2760/9816914
Ember. (2024). Electricity Data Explorer [Dataset]. https://ember-energy.org/data/electricity-data-explorer
EM-DAT. (2025). EM-DAT - The international disaster database. https://www.emdat.be/European Commission. (2024). Global Air Pollutant Emissions EDGAR v8.1 [Dataset]. https://edgar.jrc.ec.europa.eu/dataset_ap61#sources
IEA. (n.d.). Fossil Fuel Subsidies. IEA. Retrieved April 19, 2025, from https://www.iea.org/topics/fossil-fuel-subsidies
ILO. (2025). ILOSTAT [Dataset]. https://rplumber.ilo.org/files/website/bulk/indicator.html
ITDP. (2024). The Atlas of Sustainable City Transport. https://atlas.itdp.org/
Koks, E., Rozenberg, J., Tariverdi, M., Dickens, B., Fox, C., Ginkel, K. van, & Hallegatte, S. (2023). A global assessment of national road network vulnerability. Environmental Research: Infrastructure and Sustainability, 3(2), 025008. https://doi.org/10.1088/2634-4505/acd1aa
Liu, K., Wang, Q., Wang, M., & Koks, E. E. (2023). Global transportation infrastructure exposure to the change of precipitation in a warmer world. Nature Communications, 14(1), 2541. https://doi.org/10.1038/s41467-023-38203-3
McDuffie, E. E., Martin, R. V., Spadaro, J. V., Burnett, R., Smith, S. J., O'Rourke, P., Hammer, M. S., van Donkelaar, A., Bindle, L., Shah, V., Jaeglé, L., Luo, G., Yu, F., Adeniran, J. A., Lin, J., & Brauer, M. (2021). Source sector and fuel contributions to ambient PM2.5 and attributable mortality across multiple spatial scales. Nature Communications, 12(1), 3594. https://doi.org/10.1038/s41467-021-23853-y
Parry, S. B., Antung A. Liu,Ian W. H. (2023). IMF Fossil Fuel Subsidies Data: 2023 Update. IMF. https://www.imf.org/en/publications/wp/issues/2023/08/22/imf-fossil-fuel-subsidies-data-2023-update-537281
Simkins, A. T., Beresford, A. E., Buchanan, G. M., Crowe, O., Elliott, W., Izquierdo, P., Patterson, D. J., & Butchart, S. H. M. (2023). A global assessment of the prevalence of current and potential future infrastructure in Key Biodiversity Areas. Biological Conservation, 281, 109953. https://doi.org/10.1016/j.biocon.2023.109953
Sims, M., Stanimirova, R., Neumann, M., Raichuk, A., & Purves, D. (2025). New Data Shows What's Driving Forest Loss Around the World. https://www.wri.org/insights/forest-loss-drivers-data-trends
Trademap. (2025). Trade Map. Trade Map. https://www.trademap.org/Index.aspx
UN DESA. (n.d.). Economic and Environmental Vulnerability Indicators. Retrieved January 26, 2026, from https://policy.desa.un.org/themes/least-developed-countries-category/ldc-identification-criteria-indicators/evi-indicators
UN DESA. (2025). 2024 Revision of World Population Prospects. https://population.un.org/wpp/
UN Energy Statistics. (2025). Energy Balance Visualization [Dataset]. https://unstats.un.org/unsd/energystats/dataPortal/
UNEP. (2021, May 12). Domestic material consumption (DMC) and DMC per capita, per GDP (Tier I). https://www.unep.org/indicator-1222
Weiss, D. J., Nelson, A., Gibson, H. S., Temperley, W., Peedell, S., Lieber, A., Hancher, M., Poyart, E., Belchior, S., Fullman, N., Mappin, B., Dalrymple, U., Rozier, J., Lucas, T. C. D., Howes, R. E., Tusting, L. S., Kang, S. Y., Cameron, E., Bisanzio, D., … Gething, P. W. (2018). A global map of travel time to cities to assess inequalities in accessibility in 2015. Nature, 553(7688), 333-336. https://doi.org/10.1038/nature25181
WHO. (2023). Global Status Report on Road Safety 2023. https://www.who.int/teams/social-determinants-of-health/safety-and-mobility/global-status-report-on-road-safety-2023
Wiedenhofer, D., Baumgart, A., Matej, S., Virág, D., Kalt, G., Lanau, M., Tingley, D. D., Liu, Z., Guo, J., Tanikawa, H., & Haberl, H. (2024). Mapping and modelling global mobility infrastructure stocks, material flows and their embodied greenhouse gas emissions [Dataset]. https://doi.org/10.1016/j.jclepro.2023.139742
World Bank. (2021). ICP 2021. https://databank.worldbank.org/source/icp-2021
World Bank. (2022a). Annual freshwater withdrawals, total (% of internal resources) [Dataset]. https://data.worldbank.org
World Bank. (2022b). Land area (sq. Km) [Dataset]. https://data.worldbank.org
World Bank. (2022c). The Global Health Cost of PM2.5 Air Pollution: A Case for Action Beyond 2021. The World Bank. https://doi.org/10.1596/978-1-4648-1816-5
World Bank. (2023). Forest area (% of land area) [Dataset]. https://data.worldbank.org/indicator/AG.LND.FRST.ZS
World Bank. (2024). Home | Logistics Performance Index (LPI). Logistics Performance Index. https://lpi.worldbank.org/
World Bank. (2025a). GDP per capita, PPP (current international $) [Dataset]. https://data.worldbank.org/indicator/NY.GDP.PCAP.PP.CD
World Bank. (2025b). GDP, PPP (current international $) [Dataset]. https://data.worldbank.org/indicator/NY.GDP.MKTP.PP.CD
World Database on Protected Areas. (2024). Protected Areas (WDPA) [Dataset]. https://www.protectedplanet.net/en/thematic-areas/wdpa?tab=WDPA