
Mongolia Green Roads Profile 2025
MONGOLIA
GREEN ROADS PROFILESupported by:
The ATO green roads profiles present country-level perspectives on how 35 Asia-Pacific economies are addressing the development and management of sustainable eco-friendly roads. Drawing from diverse datasets and policy documents, the profiles highlight practices and measures that contribute to greener transport infrastructure.
Developed by the Asian Transport Observatory (ATO) in partnership with the International Road Federation (IRF), the profiles are designed to complement the Green Roads Toolkit. The toolkit provides a practical reference for integrating good practices across nine dimensions:
- Decarbonization
- Climate resilience
- Water and land management
- Pollution reduction
- Conserving biodiversity
- Responsible sourcing of materials
- Improving quality of life
- Disaster preparedness
- Fostering inclusive growth
This 2025 edition builds on earlier work to provide a comprehensive resource for guiding the planning, development, construction, and management of greener, more sustainable roads.
Background
Indicator - Dimension Matrix

Mongolia's vast geography, spanning 1.6 million square kilometers, creates a unique infrastructure paradox: the imperative for connectivity often conflicts with the preservation of fragile ecosystems and the urgent need for decarbonization. The national road network, extending 113,000 kilometers in 2024, is overwhelmingly dominated by local and rural tracks (90%), with primary highways constituting a mere 4%. This disparate connectivity underpins a motorization rate of 302 vehicles per 1,000 inhabitants—approaching the Asia-Pacific average of 317.
Road transport alone now accounts for 2.4 million tonnes of CO2 equivalent (CO2e), representing nearly three-quarters of the entire transport sector's emissions burden. While the economy-wide emissions grew by 5.4% annually since 2000, road transport emissions tracked closely behind at 4.8%, signalling a persistent decoupling challenge between economic activity and fossil fuel consumption.
The trajectory of emissions intensity offers a nuanced narrative of efficiency gains versus absolute growth. Since 1990, road transport emissions intensity has fallen from 155 grams of CO2e per USD of GDP to 35 grams in 2024. Despite this rapid improvement—outpacing regional reductions in East Asia since 2015—Mongolia's intensity remains significantly higher than the Asia-Pacific average of 26 grams. This efficiency gap is exacerbated by a vehicle fleet heavily skewed towards light-duty vehicles (64%) and trucks (26%), with the latter largely responsible for freight emissions.
The current energy mix remains entrenched in carbon-intensive sources; fossil fuel subsidies for petroleum continue to distort the market, incurring societal external costs where road crashes and congestion account for 55% and 45% respectively.
Electrification presents a nascent but complicated pathway. Between 2015 and 2024, electric vehicle (EV) imports totaled 87 million USD, yet by 2024, they comprised only 2% of total road vehicle imports. The composition of this intake—78% light-duty vehicles and 13% goods vehicles/buses—suggests a market responding to urban mobility needs rather than heavy freight decarbonization. Hybrid electric vehicles account for 29.9% of all state-inspected vehicles in Mongolia, ranking second after petrol vehicles at 41.2%. The ongoing increase in imported cars over recent years is mainly due to the exemption of hybrids from excise duties and air pollution regulations.
The emissions abatement potential of EVs is severely constrained by the upstream power generation mix. With a grid emission factor of 808 grams CO2 per kWh, Mongolia's electricity supply is nearly 45% more carbon-intensive than the Asia-Pacific average. Consequently, a shift to electromobility without concurrent grid decarbonization yields marginal net climate benefits. The UNEP E-mobility Readiness Index reflects this structural bottleneck, scoring Mongolia 58 out of 100, with particularly low performance in policy (10/100) and financial support frameworks (14/100).
Climate resilience poses an immediate threat to physical asset integrity. Under a high-warming scenario (4.5-degree increase), distinct vulnerabilities emerge in the structural durability of the network. More than 11% of road and rail assets face exposure to intensified precipitation regimes. Current estimates suggest average annual infrastructure losses of 907.4 thousand USD, a figure that disproportionately impacts critical nodes; bridges and tunnels, despite constituting negligible track length, absorb 1.6% of these financial losses. This physical vulnerability compounds existing logistical inefficiencies. The National Road Vulnerability Index places Mongolia 65th globally, reflecting high susceptibility to network failure where the loss of a key segment could sever critical supply lines. Due to the combined effects of climate change and human activities, warm permafrost with high ice content has been degrading rapidly, a condition by which Mongolia is susceptible to, with more than 1,400 kilometers of its road network passing through permafrost regions (Ganbold et al. 2022). Numerous studies report that this degradation leads to significant subsidence and deformation of paved roads and associated road structures constructed in such areas.
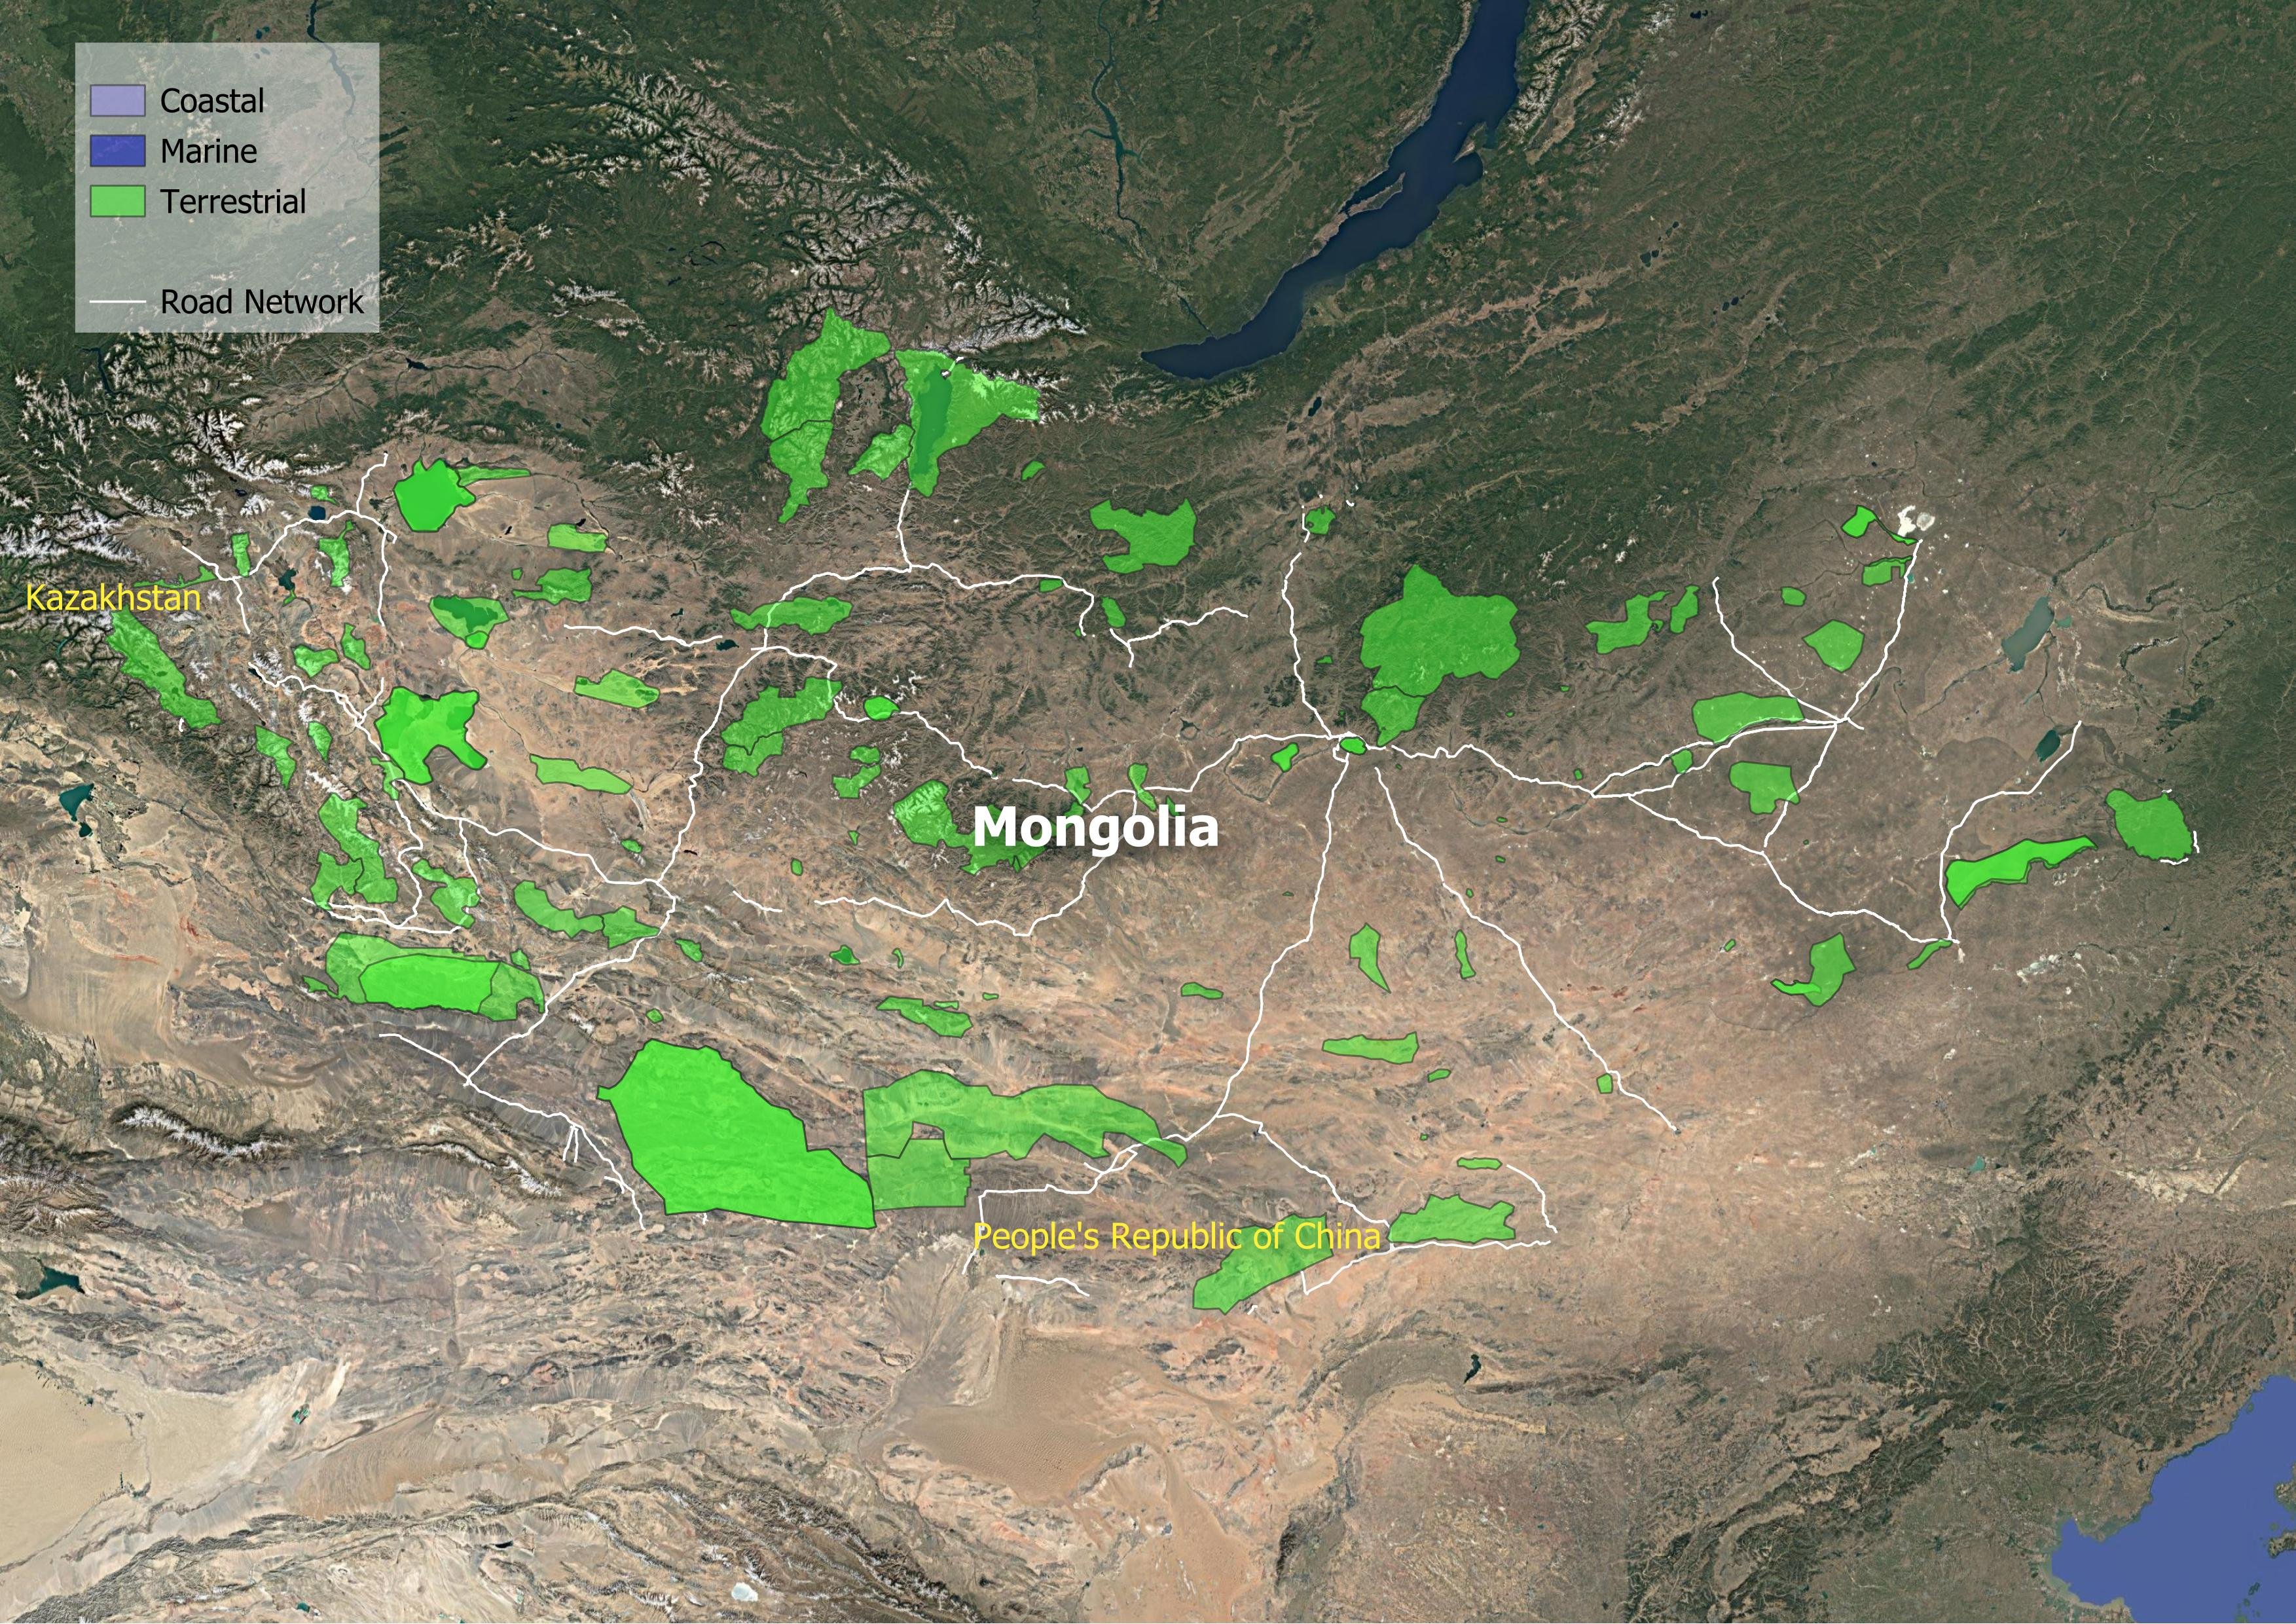
The intersection of infrastructure expansion and biodiversity conservation remains a friction point. Approximately 20% of Mongolia's territory is protected, yet linear infrastructure continues to fragment these habitats. Research identifies road encroachments within 49 of the country's 68 Key Biodiversity Areas (KBAs), equating to a density of 20 meters per thousand square kilometers of KBA. While lower than regional averages, the ecological sensitivity of the steppe magnifies the impact. Nine identified road projects, spanning 3,767 kilometers, threaten to disrupt 4.9 million tonnes of carbon stocks and impair nitrogen retention services. The material footprint of the road network is equally substantial, with a stock of 521.3 million tonnes and an annual maintenance requirement that embodies 436 thousand tonnes of CO2e.
Human health and social equity indicators reveal the hidden costs of the current transport paradigm. Road transport contributes to ambient PM 2.5 concentrations that reached 39 micrograms per cubic meter in 2019, driving health damages valued by the World Bank at 3.8 billion USD—nearly 9% of GDP. Beyond pollution, the road network suffers from severe spatial inequality. Over 340,000 rural residents live beyond the reach of all-season roads, severing access to markets and emergency services. In urban agglomerations, public transport accessibility is virtually non-existent for 80% of residents, and 61% of the national population resides more than 30 minutes from a major city.
The prevailing data indicates that while vehicle efficiency has improved, the absolute growth in fossil-fuel-powered mobility and the high carbon intensity of the electrical grid dampen the potential of a straightforward EV transition. Policymakers face a tripartite challenge: decarbonizing the heavy-freight dominated fleet, hardening infrastructure against projected hydrometeorological extremes, and mitigating the ecological fragmentation.
Decarbonization
Climate Resilience
Water and Land Management
Reducing Pollution
Preserving Biodiversity
Sustainable Materials Sourcing and Construction Practices
Improving Quality of life
Disaster Preparedness
Fostering Inclusive Growth
Supporting Information
Road Infrastructure Pipeline
| Cross-Border Road Development for Tourism | 2020 | None | 124.5 |
| Improving Transport Services in Ger Areas | 2019 | 2.5 million USD | None |
| Khovd–Ulaangom Connector Road | 2020 | None | 163.3 |
| Regional Road Development and Maintenance Project | 2018 | 121.9 million USD | None |
| Regional Road Development and Maintenance Project (Phase 3) | 2023 | 158 million USD | None |
| Ulaanbaatar Darkhan Road | 2019 | None | None |
| Ulaanbaatar Sustainable Urban Transport Project | 2021 | 100 million USD | None |
| Ulaanbaatar Sustainable Urban Transport Project Additional Financing | 2022 | 2.7 million USD | None |
| Ulaanbaatar Urban Road Decongestion Program | 2020 | None | None |
| Ulaanbaatar Darkhan Road | 2019 | None | None |
Road User Charging
| Actual maintenance budget | 21 |
| Required maintenance budget | 120 |
| Maintenance budget deficit | 100 |
| Gasoline and diesel tax | 6.5 |
| Fuel excise tax | 96.5 |
| Vehicle excise tax | 65.7 |
| Vehicle customs duty | 21 |
| Vehicle value added tax | 42.1 |
| Annual vehicle registration tax | 4.3 |
| Tolling | 3.3 |
Unit Cost Road Projects
Road Transport Policy Landscape
Road Transport Policy Targets
| State Policy on Automobile Sector | 2026 | Cargo terminal = 21 |
| State Policy on Automobile Sector | 2026 | Infrastructure Quality in Global Competitiveness Indicators = 74 |
| State Policy on Automobile Sector | 2026 | Logistics center = 6 |
| Vision 2050 - MNG | 2025 | Number of new regional transport and logistic centers = 4 |
| Vision 2050 - MNG | 2030 | Number of new regional transport and logistic centers = 7 |
| Vision 2050 - MNG | 2050 | Number of new regional transport and logistic centers = 11 |
| State Policy on Automobile Sector | 2026 | National paved road = 7500 km |
| Vision 2050 - MNG | 2025 | The length of new national roads to be built = 6616 |
| Vision 2050 - MNG | 2030 | The length of new national roads to be built = 8055 |
| Vision 2050 - MNG | 2050 | The length of new national roads to be built = 8831 |
Road Transport Policy Measure Types
References
AIIB. (n.d.). MEASURING TRANSPORT CONNECTIVITY FOR TRADE IN ASIA. https://impact.economist.com/perspectives/sites/default/files/eco141_aiib_transport_connectivity_4.pdf/
Asian Transport Observatory. (2025). Asia and the Pacific's Transport Infrastructure and Investment Outlook 2035. https://asiantransportobservatory.org/analytical-outputs/asia-transport-infrastructure-investment-needs/
Barrington-Leigh, C., & Millard-Ball, A. (2025). A high-resolution global time series of street-network sprawl. https://journals.sagepub.com/doi/10.1177/23998083241306829
CDRI. (2023). Global Infrastructure Risk Model and Resilience Index. https://giri.unepgrid.ch/
CIESIN. (2023a). Rural Access Index [Dataset]. https://sedac.ciesin.columbia.edu/data/set/sdgi-9-1-1-rai-2023
CIESIN. (2023b). SDG Indicator 11.2.1: Urban Access to Public Transport, 2023 Release: Sustainable Development Goal Indicators (SDGI). https://sedac.ciesin.columbia.edu/data/set/sdgi-11-2-1-urban-access-public-transport-2023
EDGAR. (2025). GHG emissions of all world countries: 2025. Publications Office. https://data.europa.eu/doi/10.2760/9816914
Ember. (2024). Electricity Data Explorer [Dataset]. https://ember-energy.org/data/electricity-data-explorer
EM-DAT. (2025). EM-DAT - The international disaster database. https://www.emdat.be/European Commission. (2024). Global Air Pollutant Emissions EDGAR v8.1 [Dataset]. https://edgar.jrc.ec.europa.eu/dataset_ap61#sources
Ganbold, U., Yamkhin, J., & Ganbold, B. (2022). Results of the permafrost investigation of road: (A case study of the Tsagaannuur-Ulaanbaishint route). Mongolian Journal of Geography and Geoecology, 145-155.https://doi.org/10.5564/mjgg.v59i43.2522
IEA. (n.d.). Fossil Fuel Subsidies. IEA. Retrieved April 19, 2025, from https://www.iea.org/topics/fossil-fuel-subsidies
ILO. (2025). ILOSTAT [Dataset]. https://rplumber.ilo.org/files/website/bulk/indicator.html
ITDP. (2024). The Atlas of Sustainable City Transport. https://atlas.itdp.org/
Koks, E., Rozenberg, J., Tariverdi, M., Dickens, B., Fox, C., Ginkel, K. van, & Hallegatte, S. (2023). A global assessment of national road network vulnerability. Environmental Research: Infrastructure and Sustainability, 3(2), 025008. https://doi.org/10.1088/2634-4505/acd1aa
Liu, K., Wang, Q., Wang, M., & Koks, E. E. (2023). Global transportation infrastructure exposure to the change of precipitation in a warmer world. Nature Communications, 14(1), 2541. https://doi.org/10.1038/s41467-023-38203-3
McDuffie, E. E., Martin, R. V., Spadaro, J. V., Burnett, R., Smith, S. J., O'Rourke, P., Hammer, M. S., van Donkelaar, A., Bindle, L., Shah, V., Jaeglé, L., Luo, G., Yu, F., Adeniran, J. A., Lin, J., & Brauer, M. (2021). Source sector and fuel contributions to ambient PM2.5 and attributable mortality across multiple spatial scales. Nature Communications, 12(1), 3594. https://doi.org/10.1038/s41467-021-23853-y
Parry, S. B., Antung A. Liu,Ian W. H. (2023). IMF Fossil Fuel Subsidies Data: 2023 Update. IMF. https://www.imf.org/en/publications/wp/issues/2023/08/22/imf-fossil-fuel-subsidies-data-2023-update-537281
Simkins, A. T., Beresford, A. E., Buchanan, G. M., Crowe, O., Elliott, W., Izquierdo, P., Patterson, D. J., & Butchart, S. H. M. (2023). A global assessment of the prevalence of current and potential future infrastructure in Key Biodiversity Areas. Biological Conservation, 281, 109953. https://doi.org/10.1016/j.biocon.2023.109953
Sims, M., Stanimirova, R., Neumann, M., Raichuk, A., & Purves, D. (2025). New Data Shows What's Driving Forest Loss Around the World. https://www.wri.org/insights/forest-loss-drivers-data-trends
Trademap. (2025). Trade Map. Trade Map. https://www.trademap.org/Index.aspx
UN DESA. (n.d.). Economic and Environmental Vulnerability Indicators. Retrieved January 26, 2026, from https://policy.desa.un.org/themes/least-developed-countries-category/ldc-identification-criteria-indicators/evi-indicators
UN DESA. (2025). 2024 Revision of World Population Prospects. https://population.un.org/wpp/
UN Energy Statistics. (2025). Energy Balance Visualization [Dataset]. https://unstats.un.org/unsd/energystats/dataPortal/
UNEP. (2021, May 12). Domestic material consumption (DMC) and DMC per capita, per GDP (Tier I). https://www.unep.org/indicator-1222
Weiss, D. J., Nelson, A., Gibson, H. S., Temperley, W., Peedell, S., Lieber, A., Hancher, M., Poyart, E., Belchior, S., Fullman, N., Mappin, B., Dalrymple, U., Rozier, J., Lucas, T. C. D., Howes, R. E., Tusting, L. S., Kang, S. Y., Cameron, E., Bisanzio, D., … Gething, P. W. (2018). A global map of travel time to cities to assess inequalities in accessibility in 2015. Nature, 553(7688), 333-336. https://doi.org/10.1038/nature25181
WHO. (2023). Global Status Report on Road Safety 2023. https://www.who.int/teams/social-determinants-of-health/safety-and-mobility/global-status-report-on-road-safety-2023
Wiedenhofer, D., Baumgart, A., Matej, S., Virág, D., Kalt, G., Lanau, M., Tingley, D. D., Liu, Z., Guo, J., Tanikawa, H., & Haberl, H. (2024). Mapping and modelling global mobility infrastructure stocks, material flows and their embodied greenhouse gas emissions [Dataset]. https://doi.org/10.1016/j.jclepro.2023.139742
World Bank. (2021). ICP 2021. https://databank.worldbank.org/source/icp-2021
World Bank. (2022a). Annual freshwater withdrawals, total (% of internal resources) [Dataset]. https://data.worldbank.org
World Bank. (2022b). Land area (sq. Km) [Dataset]. https://data.worldbank.org
World Bank. (2022c). The Global Health Cost of PM2.5 Air Pollution: A Case for Action Beyond 2021. The World Bank. https://doi.org/10.1596/978-1-4648-1816-5
World Bank. (2023). Forest area (% of land area) [Dataset]. https://data.worldbank.org/indicator/AG.LND.FRST.ZS
World Bank. (2024). Home | Logistics Performance Index (LPI). Logistics Performance Index. https://lpi.worldbank.org/
World Bank. (2025a). GDP per capita, PPP (current international $) [Dataset]. https://data.worldbank.org/indicator/NY.GDP.PCAP.PP.CD
World Bank. (2025b). GDP, PPP (current international $) [Dataset]. https://data.worldbank.org/indicator/NY.GDP.MKTP.PP.CD
World Database on Protected Areas. (2024). Protected Areas (WDPA) [Dataset]. https://www.protectedplanet.net/en/thematic-areas/wdpa?tab=WDPA