
Malaysia Green Roads Profile 2025
MALAYSIA
GREEN ROADS PROFILESupported by:
The ATO green roads profiles present country-level perspectives on how 35 Asia-Pacific economies are addressing the development and management of sustainable eco-friendly roads. Drawing from diverse datasets and policy documents, the profiles highlight practices and measures that contribute to greener transport infrastructure.
Developed by the Asian Transport Observatory (ATO) in partnership with the International Road Federation (IRF), the profiles are designed to complement the Green Roads Toolkit. The toolkit provides a practical reference for integrating good practices across nine dimensions:
- Decarbonization
- Climate resilience
- Water and land management
- Pollution reduction
- Conserving biodiversity
- Responsible sourcing of materials
- Improving quality of life
- Disaster preparedness
- Fostering inclusive growth
This 2025 edition builds on earlier work to provide a comprehensive resource for guiding the planning, development, construction, and management of greener, more sustainable roads.
Background
Indicator - Dimension Matrix

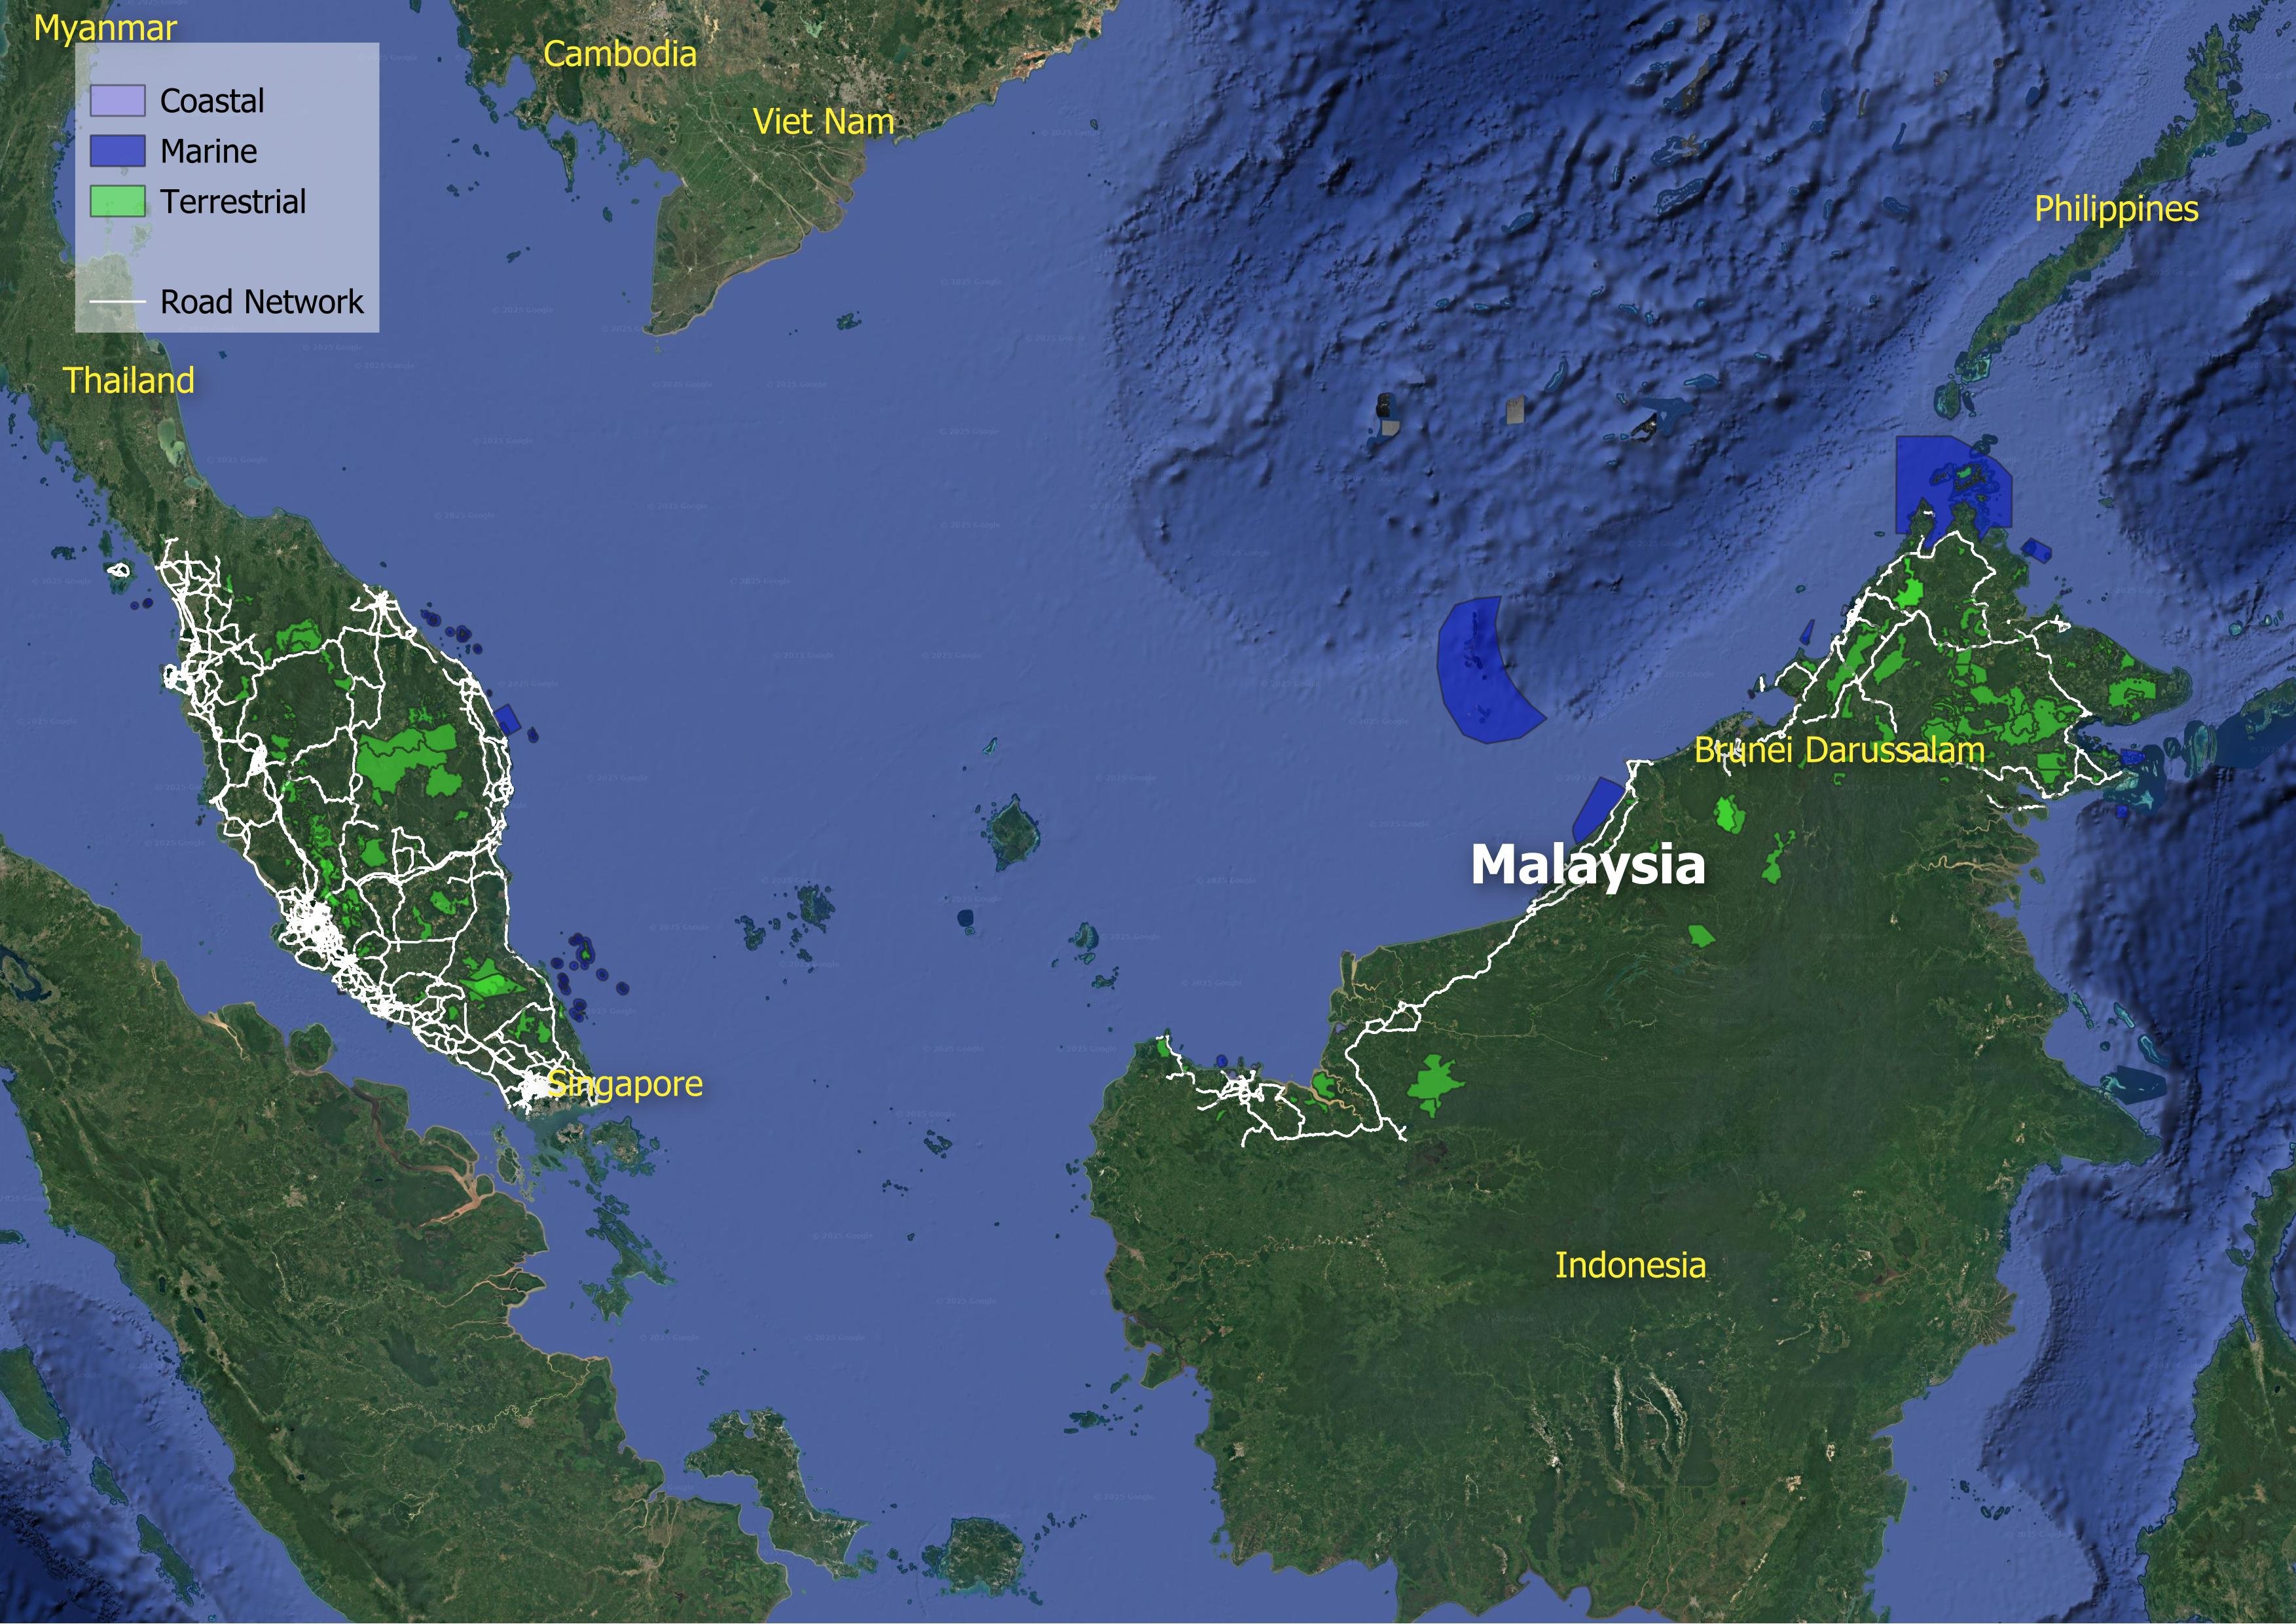
The Malaysian landscape is defined by its connectivity. Spread over roughly 329,000 square kilometers, the nation maintains a road network that measured 316,300 kilometers in 2024. It averages 963 meters of road for every square kilometer of land. Unlike the arterial focus of some neighbors, 90% of the infrastructure consists of local and rural roads, while motorways and primary highways account for just 4%.
The sheer availability of road has outpaced population growth. In 2000, there were 2.9 kilometers of road for every thousand Malaysians; by 2024, that figure had climbed to 8.9 kilometers. Yet, this expansion has not alleviated the pressure of demand. Motorization stands at 909 vehicles per thousand people, a staggering density that dwarfs the Asia-Pacific average of 317. The fleet is a balanced duality of light-duty vehicles (47%) and two-wheelers (47%), leaving public transport vehicles like buses at 1%.
Carbon follows the vehicle ownership. In 2024, Malaysia's road transport sector emitted 59.4 million tonnes of CO2 equivalent. This single sector now accounts for 97% of total transport emissions and 18% of the entire economy's greenhouse gas footprint.
Efficiency is lagging. The carbon intensity of the road sector—measured against economic output—stands at 43 grams of CO2e per USD. By comparison, the broader Asia-Pacific average is significantly leaner at 26 grams, and the Southeast Asian average sits at 31 grams. Progress exists, but it is slow. Since 2015, intensity improved by 6.4% per year, outpacing the regional average of 5.4%, but the starting baseline remains high.
The root of this consumption lies in pricing. Price signals are muted by policy. Between 2016 and 2023, the transport sector absorbed $24.4 billion in fossil fuel subsidies. This financial cushioning distorts behavior. The external costs are not paid at the pump but are levied on society: 60% in congestion, 37% in road crashes, and 2% in infrastructure damage.
The Electric Transition and the Grid is pivoting toward electrification, yet the transition reveals a paradox. The market is moving. By 2024, electric vehicles (EVs) represented 28% of the total value of road vehicle imports, a segment dominated (98%) by light-duty vehicles. UNEP's E-mobility Readiness Index grants the country a score of 81 out of 100, reflecting strong technology and financial foundations.
However, a clean fleet requires a clean source. Malaysia's grid emission factor remains high at 604 gCO2 per kWh in 2024, dirtier than the Southeast Asian average of 583 and the Asia-Pacific average of 559.
Under a 4.5-degree warming scenario, more than 82% of Malaysia's road and rail assets face exposure to more frequent and extreme precipitation. The financial toll is already accruing. The country faces potential average annual losses of $151.6 million to transport infrastructure, with roads absorbing 58% of this damage.
The environmental footprint extends beyond carbon. The roads cut through the wild. Research indicates that of Malaysia's 59 Key Biodiversity Areas (KBAs), 44 contain road infrastructure. The density of intrusion is 38 meters per thousand square kilometers of KBA. While lower than the regional average of 88 meters , the fragmentation of habitat remains a critical threat in a nation where 58% of the land is forested.
The air in the cities carries a heavy weight. In 2022, the road sector was the sole source of transport-related PM2.5 emissions. The human cost is immediate. Exposure to tailpipe emissions and ozone caused at least 2,100 premature deaths, with the World Bank estimating the annual health damages at $36.6 billion—roughly 4% of GDP.
Access and Safety Roads are built for connection, yet access remains unequal. Despite the high vehicle ownership, the public transport system leaves many stranded. Among 37 urban agglomerations, only 16% provide convenient public transport access to at least half their population. In 41% of these cities, only two out of ten residents live within reach of a transit stop.
The reliance on private transport levies a heavy tax on household finances. Transport costs devour 10% of household expenditure. For the rural population, the challenge is physical isolation. 1.1 million rural residents live more than 2 kilometers from an all-season road, cutting them off from markets, healthcare, and education.
Safety remains a crisis. The road kills 4,680 people annually (2021). In Malaysia, road crash fatalities decreased by approximately -8.7% per year between 2016 and 2021. At this rate, Malaysia will be able to halve its road crash fatalities by 2030.
Malaysia presents a distinct profile within the Green Roads framework. It is a nation of high connectivity and aggressive motorization, where the infrastructure stock—1.5 billion tonnes of material —is vast but increasingly vulnerable to climate volatility. The challenge is about untangling the cost of mobility from the health of the economy and the safety of its people.
Decarbonization
Climate Resilience
Water and Land Management
Reducing Pollution
Preserving Biodiversity
Sustainable Materials Sourcing and Construction Practices
Improving Quality of life
Disaster Preparedness
Fostering Inclusive Growth
Supporting Information
Road Infrastructure Pipeline
| Pan Borneo Highway Project (Sabah & Sarawak) | 2015 | 2660 million MYR | 2083 |
| Port Klang Strategic Road Upgrade | 2024 | 107 million MYR | None |
Unit Cost Road Projects
Road Transport Policy Landscape
Road Transport Policy Targets
No data
Road Transport Policy Measure Types
References
AIIB. (n.d.). MEASURING TRANSPORT CONNECTIVITY FOR TRADE IN ASIA. https://impact.economist.com/perspectives/sites/default/files/eco141_aiib_transport_connectivity_4.pdf/
Asian Transport Observatory. (2025). Asia and the Pacific's Transport Infrastructure and Investment Outlook 2035. https://asiantransportobservatory.org/analytical-outputs/asia-transport-infrastructure-investment-needs/
Barrington-Leigh, C., & Millard-Ball, A. (2025). A high-resolution global time series of street-network sprawl. https://journals.sagepub.com/doi/10.1177/23998083241306829
CDRI. (2023). Global Infrastructure Risk Model and Resilience Index. https://giri.unepgrid.ch/
CIESIN. (2023a). Rural Access Index [Dataset]. https://sedac.ciesin.columbia.edu/data/set/sdgi-9-1-1-rai-2023
CIESIN. (2023b). SDG Indicator 11.2.1: Urban Access to Public Transport, 2023 Release: Sustainable Development Goal Indicators (SDGI). https://sedac.ciesin.columbia.edu/data/set/sdgi-11-2-1-urban-access-public-transport-2023
EDGAR. (2025). GHG emissions of all world countries: 2025. Publications Office. https://data.europa.eu/doi/10.2760/9816914
Ember. (2024). Electricity Data Explorer [Dataset]. https://ember-energy.org/data/electricity-data-explorer
EM-DAT. (2025). EM-DAT - The international disaster database. https://www.emdat.be/European Commission. (2024). Global Air Pollutant Emissions EDGAR v8.1 [Dataset]. https://edgar.jrc.ec.europa.eu/dataset_ap61#sources
IEA. (n.d.). Fossil Fuel Subsidies. IEA. Retrieved April 19, 2025, from https://www.iea.org/topics/fossil-fuel-subsidies
ILO. (2025). ILOSTAT [Dataset]. https://rplumber.ilo.org/files/website/bulk/indicator.html
ITDP. (2024). The Atlas of Sustainable City Transport. https://atlas.itdp.org/
Koks, E., Rozenberg, J., Tariverdi, M., Dickens, B., Fox, C., Ginkel, K. van, & Hallegatte, S. (2023). A global assessment of national road network vulnerability. Environmental Research: Infrastructure and Sustainability, 3(2), 025008. https://doi.org/10.1088/2634-4505/acd1aa
Liu, K., Wang, Q., Wang, M., & Koks, E. E. (2023). Global transportation infrastructure exposure to the change of precipitation in a warmer world. Nature Communications, 14(1), 2541. https://doi.org/10.1038/s41467-023-38203-3
McDuffie, E. E., Martin, R. V., Spadaro, J. V., Burnett, R., Smith, S. J., O'Rourke, P., Hammer, M. S., van Donkelaar, A., Bindle, L., Shah, V., Jaeglé, L., Luo, G., Yu, F., Adeniran, J. A., Lin, J., & Brauer, M. (2021). Source sector and fuel contributions to ambient PM2.5 and attributable mortality across multiple spatial scales. Nature Communications, 12(1), 3594. https://doi.org/10.1038/s41467-021-23853-y
Parry, S. B., Antung A. Liu,Ian W. H. (2023). IMF Fossil Fuel Subsidies Data: 2023 Update. IMF. https://www.imf.org/en/publications/wp/issues/2023/08/22/imf-fossil-fuel-subsidies-data-2023-update-537281
Simkins, A. T., Beresford, A. E., Buchanan, G. M., Crowe, O., Elliott, W., Izquierdo, P., Patterson, D. J., & Butchart, S. H. M. (2023). A global assessment of the prevalence of current and potential future infrastructure in Key Biodiversity Areas. Biological Conservation, 281, 109953. https://doi.org/10.1016/j.biocon.2023.109953
Sims, M., Stanimirova, R., Neumann, M., Raichuk, A., & Purves, D. (2025). New Data Shows What's Driving Forest Loss Around the World. https://www.wri.org/insights/forest-loss-drivers-data-trends
Trademap. (2025). Trade Map. Trade Map. https://www.trademap.org/Index.aspx
UN DESA. (n.d.). Economic and Environmental Vulnerability Indicators. Retrieved January 26, 2026, from https://policy.desa.un.org/themes/least-developed-countries-category/ldc-identification-criteria-indicators/evi-indicators
UN DESA. (2025). 2024 Revision of World Population Prospects. https://population.un.org/wpp/
UN Energy Statistics. (2025). Energy Balance Visualization [Dataset]. https://unstats.un.org/unsd/energystats/dataPortal/
UNEP. (2021, May 12). Domestic material consumption (DMC) and DMC per capita, per GDP (Tier I). https://www.unep.org/indicator-1222
Weiss, D. J., Nelson, A., Gibson, H. S., Temperley, W., Peedell, S., Lieber, A., Hancher, M., Poyart, E., Belchior, S., Fullman, N., Mappin, B., Dalrymple, U., Rozier, J., Lucas, T. C. D., Howes, R. E., Tusting, L. S., Kang, S. Y., Cameron, E., Bisanzio, D., … Gething, P. W. (2018). A global map of travel time to cities to assess inequalities in accessibility in 2015. Nature, 553(7688), 333-336. https://doi.org/10.1038/nature25181
WHO. (2023). Global Status Report on Road Safety 2023. https://www.who.int/teams/social-determinants-of-health/safety-and-mobility/global-status-report-on-road-safety-2023
Wiedenhofer, D., Baumgart, A., Matej, S., Virág, D., Kalt, G., Lanau, M., Tingley, D. D., Liu, Z., Guo, J., Tanikawa, H., & Haberl, H. (2024). Mapping and modelling global mobility infrastructure stocks, material flows and their embodied greenhouse gas emissions [Dataset]. https://doi.org/10.1016/j.jclepro.2023.139742
World Bank. (2021). ICP 2021. https://databank.worldbank.org/source/icp-2021
World Bank. (2022a). Annual freshwater withdrawals, total (% of internal resources) [Dataset]. https://data.worldbank.org
World Bank. (2022b). Land area (sq. Km) [Dataset]. https://data.worldbank.org
World Bank. (2022c). The Global Health Cost of PM2.5 Air Pollution: A Case for Action Beyond 2021. The World Bank. https://doi.org/10.1596/978-1-4648-1816-5
World Bank. (2023). Forest area (% of land area) [Dataset]. https://data.worldbank.org/indicator/AG.LND.FRST.ZS
World Bank. (2024). Home | Logistics Performance Index (LPI). Logistics Performance Index. https://lpi.worldbank.org/
World Bank. (2025a). GDP per capita, PPP (current international $) [Dataset]. https://data.worldbank.org/indicator/NY.GDP.PCAP.PP.CD
World Bank. (2025b). GDP, PPP (current international $) [Dataset]. https://data.worldbank.org/indicator/NY.GDP.MKTP.PP.CD
World Database on Protected Areas. (2024). Protected Areas (WDPA) [Dataset]. https://www.protectedplanet.net/en/thematic-areas/wdpa?tab=WDPA