
Lao People's Democratic Republic Green Roads Profile 2025
LAO PEOPLE'S DEMOCRATIC REPUBLIC
GREEN ROADS PROFILESupported by:
The ATO green roads profiles present country-level perspectives on how 35 Asia-Pacific economies are addressing the development and management of sustainable eco-friendly roads. Drawing from diverse datasets and policy documents, the profiles highlight practices and measures that contribute to greener transport infrastructure.
Developed by the Asian Transport Observatory (ATO) in partnership with the International Road Federation (IRF), the profiles are designed to complement the Green Roads Toolkit. The toolkit provides a practical reference for integrating good practices across nine dimensions:
- Decarbonization
- Climate resilience
- Water and land management
- Pollution reduction
- Conserving biodiversity
- Responsible sourcing of materials
- Improving quality of life
- Disaster preparedness
- Fostering inclusive growth
This 2025 edition builds on earlier work to provide a comprehensive resource for guiding the planning, development, construction, and management of greener, more sustainable roads.
Background
Indicator - Dimension Matrix

The geography of the Lao People's Democratic Republic is characterized by infrastructure gap. Covering about 231,000 square kilometers, the country has a road network of 64.8 thousand kilometers built on fragile foundations. Ninety percent of these are local and rural roads, leaving the main arteries sparse; only 2% are motorways or primary highways. Infrastructure density is low at 281 meters per square kilometer. Despite this, the demand for mobility is high, with motorization rates reaching 371 vehicles per thousand people, surpassing the Asia-Pacific average of 317. The fleet is mostly two-wheelers, making up 75% of all traffic.
This mobility results in high carbon emissions, with road transport releasing 2.7 million tonnes of CO2e in 2024. Emissions have grown steadily, at a rate of 5.3% annually since 2000. While the economy expands, Emissions per USD of GDP are 35 grams of CO2e, higher than the regional average of 26 in Asia-Pacific and 31 in Southeast Asia. Lao PDR burns more fuel for less economic gain, revealing a structural inefficiency.
However, a shift is happening in the import markets. Electric vehicle imports were valued at $226 million from 2015 to 2024, and by 2024, EVs represented 16% of all road vehicle imports. This indicates a market responding quickly to fuel costs and availability, outpacing policies. Yet, a clean fleet is ineffective if the grid is dirty or roads are washed away.
Water is the main threat to Lao roads. The country uses 7.4 billion cubic meters of freshwater annually, but rainfall, often uncontrolled, determines infrastructure lifespan. Under a 4.5°C warming scenario, over 36% of roads and rail assets are vulnerable to extreme, frequent precipitation. Damages already cost about $5.3 million annually, with bridges and tunnels—only 0.2% of infrastructure—accounting for 2% of these losses. These are critical points: when a bridge fails, the network breaks, not just slows down. The Asian Infrastructure Investment Bank rates the network efficiency at 0.48 out of 1.0, indicating that half the potential is lost to poor surfaces, congestion, and indirect routes.
Air quality in valleys is worsening, with PM 2.5 levels reaching 19.7 micrograms per cubic meter in 2019. The health toll includes at least 94 premature deaths annually and economic costs amounting to 9% of GDP. The sole contributor to transport-related PM 2.5 emissions is the road sector, creating a pollution cycle.
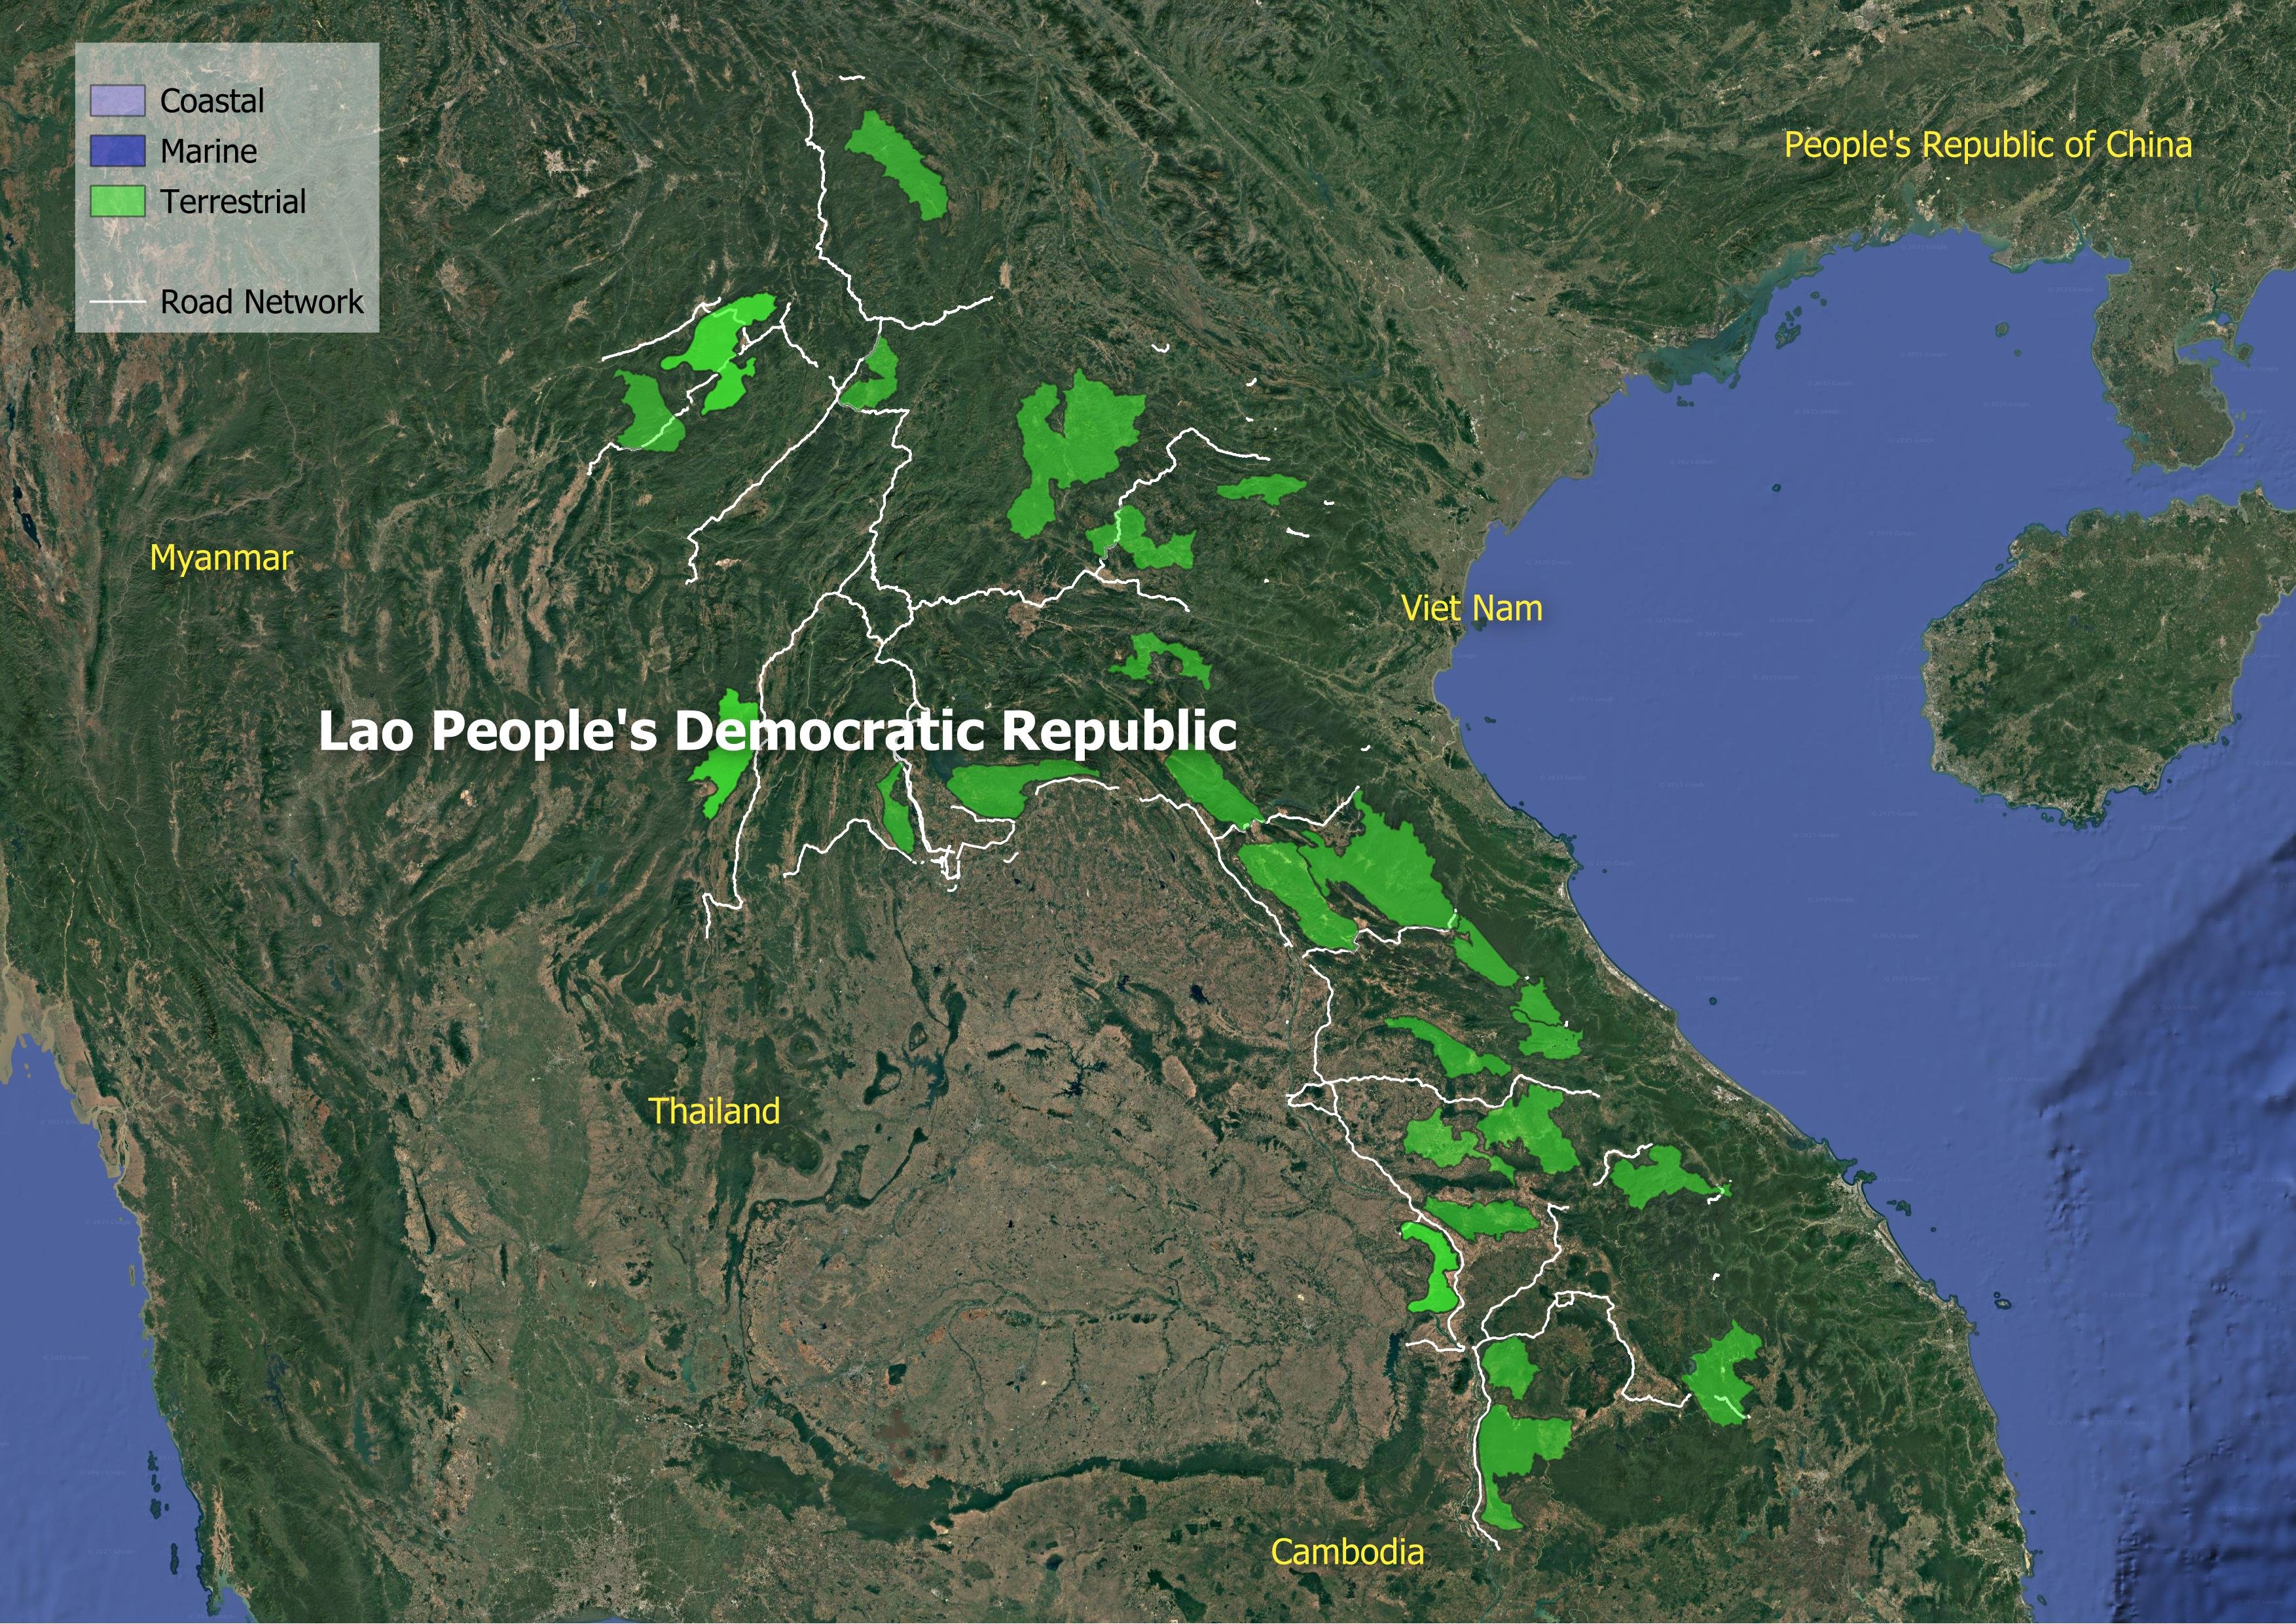
Biodiversity suffers silently. The country is 71% forested, a vital green area in a declining region, but roads are encroaching. In 45 Key Biodiversity Areas (KBA), road density is 38 meters per thousand square kilometers—lower than Southeast Asia's average of 83—but every meter of asphalt causes habitat fragmentation. The UN Environment Programme highlights that five road projects, totaling 665 km, threaten nearly a million tonnes of carbon stock, presenting stark trade-offs.
Access remains a critical issue. About 1.4 million rural residents are more than two kilometers from an all-season road, leading to isolation, especially during the rainy season. This lack of connectivity explains the decline in the Logistics Performance Index from 82 in 2018 to 115 in 2023, since trade depends on movement. Road safety is also a concern—WHO reported 1,217 fatalities in 2021.Road crashes impose a substantial economic burden on Lao PDR. In 2021, the estimated cost of fatalities and serious injuries reached approximately 822 million USD, equivalent to 4% of the country's GDP. This surpasses the healthcare expenditure of 2.7% of GDP in the same year, highlighting the significant strain road crashes place on the economy.
The sector generates employment but lacks equity. Transport employs 70,000 people, yet women comprise only 7.9% of this workforce. The economic burden of movement is heavy on households, consuming 6.7% of their expenditure.
Lao PDR faces a fragile development path. The high motorization, driven by two-wheelers, reflects a desperate need for mobility amid an inadequate and climate-vulnerable network. While electric vehicle adoption hints at a cleaner future, the core issues—high emissions, rural isolation, and fragile infrastructure—highlight systemic stress.
Decarbonization
Climate Resilience
Water and Land Management
Reducing Pollution
Preserving Biodiversity
Sustainable Materials Sourcing and Construction Practices
Improving Quality of life
Disaster Preparedness
Fostering Inclusive Growth
Supporting Information
Road Infrastructure Pipeline
| Concrete Road Construction – Road 11E (Kaysone to Heuan Hin) | 2016 | None | None |
| Double-Layer Paving, Road 8534 to Southern Road 13 Junction | 2016 | None | None |
| Lao PDR Climate Resilient Road Connectivity Improvement Project | 2024 | 34 million USD | None |
| Lao PDR: Climate Resilience Improvement of National Road 13 South Project (Section 3) | 2020 | None | 78 |
| Lao PDR: National Road 13 South Extension Improvement and Maintenance Project | 2024 | None | 50 |
| Lao People’s Democratic Republic: National Road 13 Improvement and Maintenance Project | 2019 | None | 58 |
| National Road 19 (Hatsa–Pakha) Border Corridor Upgrade | 2016 | None | 50 |
| Samneua–Nongkhang Airport Road Paving Project | 2015 | None | None |
| Xiangkhouang–Myanmar Bridge to Bokeo Border Road Paving | 2016 | None | None |
| Xiangkok–Myanmar Bridge to R3 Road Paving | 2016 | None | None |
Unit Cost Road Projects
Road Transport Policy Landscape
Road Transport Policy Targets
| 9TH FIVE-YEAR NATIONAL SOCIOECONOMIC DEVELOPMENT PLAN (2021-2025) | 2025 | Build, upgrade, rehabilitate and maintain 2,800 km of land transport infrastructure, including roads, bridges and express ways as part of the network along the economic corridors connecting the countries in the region in accordance with ASEAN technical standards. |
| 2021-2030 National Road Safety Strategy and 2021-2025 Action Plan | 2025 | Safety classification of the International Safety Assessment Agency (iRAP) for the ASEAN highway network = At least 3 stars Traveling on major roads in the city requires a safety rating of three stars or higher = 75% |
| 9TH FIVE-YEAR NATIONAL SOCIOECONOMIC DEVELOPMENT PLAN (2021-2025) | 2025 | Build, upgrade, rehabilitate and maintain 2,800 km of land transport infrastructure, including roads, bridges and express ways as part of the network along the economic corridors connecting the countries in the region in accordance with ASEAN technical standards. |
| 9TH FIVE-YEAR NATIONAL SOCIOECONOMIC DEVELOPMENT PLAN (2021-2025) | 2025 | Build, upgrade, rehabilitate and maintain 2,800 km of land transport infrastructure, including roads, bridges and express ways as part of the network along the economic corridors connecting the countries in the region in accordance with ASEAN technical standards. |
Road Transport Policy Measure Types
References
AIIB. (n.d.). MEASURING TRANSPORT CONNECTIVITY FOR TRADE IN ASIA. https://impact.economist.com/perspectives/sites/default/files/eco141_aiib_transport_connectivity_4.pdf/
Asian Transport Observatory. (2025). Asia and the Pacific's Transport Infrastructure and Investment Outlook 2035. https://asiantransportobservatory.org/analytical-outputs/asia-transport-infrastructure-investment-needs/
Barrington-Leigh, C., & Millard-Ball, A. (2025). A high-resolution global time series of street-network sprawl. https://journals.sagepub.com/doi/10.1177/23998083241306829
CDRI. (2023). Global Infrastructure Risk Model and Resilience Index. https://giri.unepgrid.ch/
CIESIN. (2023a). Rural Access Index [Dataset]. https://sedac.ciesin.columbia.edu/data/set/sdgi-9-1-1-rai-2023
CIESIN. (2023b). SDG Indicator 11.2.1: Urban Access to Public Transport, 2023 Release: Sustainable Development Goal Indicators (SDGI). https://sedac.ciesin.columbia.edu/data/set/sdgi-11-2-1-urban-access-public-transport-2023
EDGAR. (2025). GHG emissions of all world countries: 2025. Publications Office. https://data.europa.eu/doi/10.2760/9816914
Ember. (2024). Electricity Data Explorer [Dataset]. https://ember-energy.org/data/electricity-data-explorer
EM-DAT. (2025). EM-DAT - The international disaster database. https://www.emdat.be/European Commission. (2024). Global Air Pollutant Emissions EDGAR v8.1 [Dataset]. https://edgar.jrc.ec.europa.eu/dataset_ap61#sources
IEA. (n.d.). Fossil Fuel Subsidies. IEA. Retrieved April 19, 2025, from https://www.iea.org/topics/fossil-fuel-subsidies
ILO. (2025). ILOSTAT [Dataset]. https://rplumber.ilo.org/files/website/bulk/indicator.html
ITDP. (2024). The Atlas of Sustainable City Transport. https://atlas.itdp.org/
Koks, E., Rozenberg, J., Tariverdi, M., Dickens, B., Fox, C., Ginkel, K. van, & Hallegatte, S. (2023). A global assessment of national road network vulnerability. Environmental Research: Infrastructure and Sustainability, 3(2), 025008. https://doi.org/10.1088/2634-4505/acd1aa
Liu, K., Wang, Q., Wang, M., & Koks, E. E. (2023). Global transportation infrastructure exposure to the change of precipitation in a warmer world. Nature Communications, 14(1), 2541. https://doi.org/10.1038/s41467-023-38203-3
McDuffie, E. E., Martin, R. V., Spadaro, J. V., Burnett, R., Smith, S. J., O'Rourke, P., Hammer, M. S., van Donkelaar, A., Bindle, L., Shah, V., Jaeglé, L., Luo, G., Yu, F., Adeniran, J. A., Lin, J., & Brauer, M. (2021). Source sector and fuel contributions to ambient PM2.5 and attributable mortality across multiple spatial scales. Nature Communications, 12(1), 3594. https://doi.org/10.1038/s41467-021-23853-y
Parry, S. B., Antung A. Liu,Ian W. H. (2023). IMF Fossil Fuel Subsidies Data: 2023 Update. IMF. https://www.imf.org/en/publications/wp/issues/2023/08/22/imf-fossil-fuel-subsidies-data-2023-update-537281
Simkins, A. T., Beresford, A. E., Buchanan, G. M., Crowe, O., Elliott, W., Izquierdo, P., Patterson, D. J., & Butchart, S. H. M. (2023). A global assessment of the prevalence of current and potential future infrastructure in Key Biodiversity Areas. Biological Conservation, 281, 109953. https://doi.org/10.1016/j.biocon.2023.109953
Sims, M., Stanimirova, R., Neumann, M., Raichuk, A., & Purves, D. (2025). New Data Shows What's Driving Forest Loss Around the World. https://www.wri.org/insights/forest-loss-drivers-data-trends
Trademap. (2025). Trade Map. Trade Map. https://www.trademap.org/Index.aspx
UN DESA. (n.d.). Economic and Environmental Vulnerability Indicators. Retrieved January 26, 2026, from https://policy.desa.un.org/themes/least-developed-countries-category/ldc-identification-criteria-indicators/evi-indicators
UN DESA. (2025). 2024 Revision of World Population Prospects. https://population.un.org/wpp/
UN Energy Statistics. (2025). Energy Balance Visualization [Dataset]. https://unstats.un.org/unsd/energystats/dataPortal/
UNEP. (2021, May 12). Domestic material consumption (DMC) and DMC per capita, per GDP (Tier I). https://www.unep.org/indicator-1222
Weiss, D. J., Nelson, A., Gibson, H. S., Temperley, W., Peedell, S., Lieber, A., Hancher, M., Poyart, E., Belchior, S., Fullman, N., Mappin, B., Dalrymple, U., Rozier, J., Lucas, T. C. D., Howes, R. E., Tusting, L. S., Kang, S. Y., Cameron, E., Bisanzio, D., … Gething, P. W. (2018). A global map of travel time to cities to assess inequalities in accessibility in 2015. Nature, 553(7688), 333-336. https://doi.org/10.1038/nature25181
WHO. (2023). Global Status Report on Road Safety 2023. https://www.who.int/teams/social-determinants-of-health/safety-and-mobility/global-status-report-on-road-safety-2023
Wiedenhofer, D., Baumgart, A., Matej, S., Virág, D., Kalt, G., Lanau, M., Tingley, D. D., Liu, Z., Guo, J., Tanikawa, H., & Haberl, H. (2024). Mapping and modelling global mobility infrastructure stocks, material flows and their embodied greenhouse gas emissions [Dataset]. https://doi.org/10.1016/j.jclepro.2023.139742
World Bank. (2021). ICP 2021. https://databank.worldbank.org/source/icp-2021
World Bank. (2022a). Annual freshwater withdrawals, total (% of internal resources) [Dataset]. https://data.worldbank.org
World Bank. (2022b). Land area (sq. Km) [Dataset]. https://data.worldbank.org
World Bank. (2022c). The Global Health Cost of PM2.5 Air Pollution: A Case for Action Beyond 2021. The World Bank. https://doi.org/10.1596/978-1-4648-1816-5
World Bank. (2023). Forest area (% of land area) [Dataset]. https://data.worldbank.org/indicator/AG.LND.FRST.ZS
World Bank. (2024). Home | Logistics Performance Index (LPI). Logistics Performance Index. https://lpi.worldbank.org/
World Bank. (2025a). GDP per capita, PPP (current international $) [Dataset]. https://data.worldbank.org/indicator/NY.GDP.PCAP.PP.CD
World Bank. (2025b). GDP, PPP (current international $) [Dataset]. https://data.worldbank.org/indicator/NY.GDP.MKTP.PP.CD
World Database on Protected Areas. (2024). Protected Areas (WDPA) [Dataset]. https://www.protectedplanet.net/en/thematic-areas/wdpa?tab=WDPA