
Kyrgyz Republic Green Roads Profile 2025
KYRGYZ REPUBLIC
GREEN ROADS PROFILESupported by:
The ATO green roads profiles present country-level perspectives on how 35 Asia-Pacific economies are addressing the development and management of sustainable eco-friendly roads. Drawing from diverse datasets and policy documents, the profiles highlight practices and measures that contribute to greener transport infrastructure.
Developed by the Asian Transport Observatory (ATO) in partnership with the International Road Federation (IRF), the profiles are designed to complement the Green Roads Toolkit. The toolkit provides a practical reference for integrating good practices across nine dimensions:
- Decarbonization
- Climate resilience
- Water and land management
- Pollution reduction
- Conserving biodiversity
- Responsible sourcing of materials
- Improving quality of life
- Disaster preparedness
- Fostering inclusive growth
This 2025 edition builds on earlier work to provide a comprehensive resource for guiding the planning, development, construction, and management of greener, more sustainable roads.
Background
Indicator - Dimension Matrix

Geography shapes the network in the Kyrgyz Republic. Here, roads are more than just infrastructure—they form the main link across 192,000 square kilometers of rugged terrain. With a population of 7.2 million, the country depends on a 51,500-kilometer road network, whose structure reveals its connectivity story: only 5% are motorways or primary highways, while 89% are local and rural roads that reach remote valleys. The road density of 269 meters per square kilometer is below the OECD average but aligns with the mountainous landscape frontier.
The engine of the economy is decoupling from carbon, but the pace is uneven. By 2024, the sector emitted 1.4 million tonnes of CO2 equivalent. While emissions grew by 2.1% annually since 2000, the economy expanded faster, achieving a reduction in emissions intensity of 15.1% per year since 2015. This outperforms the Asia-Pacific regional average improvement of 5.4%. The carbon intensity of the road sector now stands at 25 grams of CO2e per USD of GDP, slightly leaner than the regional average of 26 grams.
Electrification is a market reality. Between 2015 and 2024, the country imported $1.2 billion worth of electric vehicles (EVs). By 2024, EVs accounted for 22% of total road vehicle imports, a figure that signals a rapid fleet transformation. The structural advantage lies in the grid. The electricity powering these vehicles carries a carbon intensity of 168 gCO2/kWh, vastly cleaner than the Central and West Asia average of 495 gCO2/kWh. However, a regression of 0.9% in grid cleanliness since 2015 warrants caution; an electric fleet is only as green as the grid behind it.
Yet, the air carries a heavy price. The external costs of transport are paid in public health. The World Bank estimates the annual cost of health damages from PM 2.5 exposure at $1.8 billion—roughly 5% of the nation's GDP. The road sector is the primary culprit, responsible for 96% of transport-related PM 2.5 emissions. This pollution, combined with ozone exposure, claimed at least 170 lives prematurely in a single year. Safety remains an equally urgent crisis. With 869 road crash fatalities in 2021.The economic burden of road crashes in the Kyrgyz Republic is substantial. Fatalities and serious injuries cost an estimated 372 million USD in 2021, equivalent to roughly 4% of the country's GDP. This is a significant drain on resources, especially when compared to the 5.4% of GDP spent on healthcare in the same year. In Kyrgyz Republic, road crash fatalities decreased by approximately -4.1% per year between 2016 and 2021. However, this is not enough to reach the 2030 target to halve the fatalities by 2030
The National Road Vulnerability Index ranks the Kyrgyz Republic 164th out of 208 countries, indicating a network with low redundancy where the loss of a key segment leads to critical failure. Nature compounds this fragility. Since 2000, landslides have accounted for 31% of natural disasters, with earthquakes and floods adding to the toll. Under a 4.5-degree warming scenario, nearly 40% of road and rail assets face exposure to extreme precipitation. The financial implication is direct: average annual losses to transport infrastructure hover around $2.4 million, with roads absorbing 85% of this damage.
Access remains the dividing line. The Rural Access Index reveals that 1.3 million people—nearly a fifth of the population—live beyond 2 kilometers of an all-season road. They are cut off from markets, healthcare, and schools. In urban centers, the situation is improving but unequal; only 33% of agglomerations provide convenient public transport access to the majority of their residents. Furthermore, the sector's economic benefits are not shared equally. Women comprise a mere 8.6% of the transport workforce, significantly lower than the already low regional averages.
The Kyrgyz Republic stands at a distinct pivot point. The rapid uptake of electric vehicles and a comparatively clean grid offer a clear pathway to decarbonization, outperspacing regional peers in intensity improvements. However, the physical network remains vulnerable to climate shocks and lacks the redundancy required for resilience. The "last mile" remains the hardest mile: 1.3 million rural residents are isolated, and the economic opportunities within the sector are not yet inclusive.
Decarbonization
Climate Resilience
Water and Land Management
Reducing Pollution
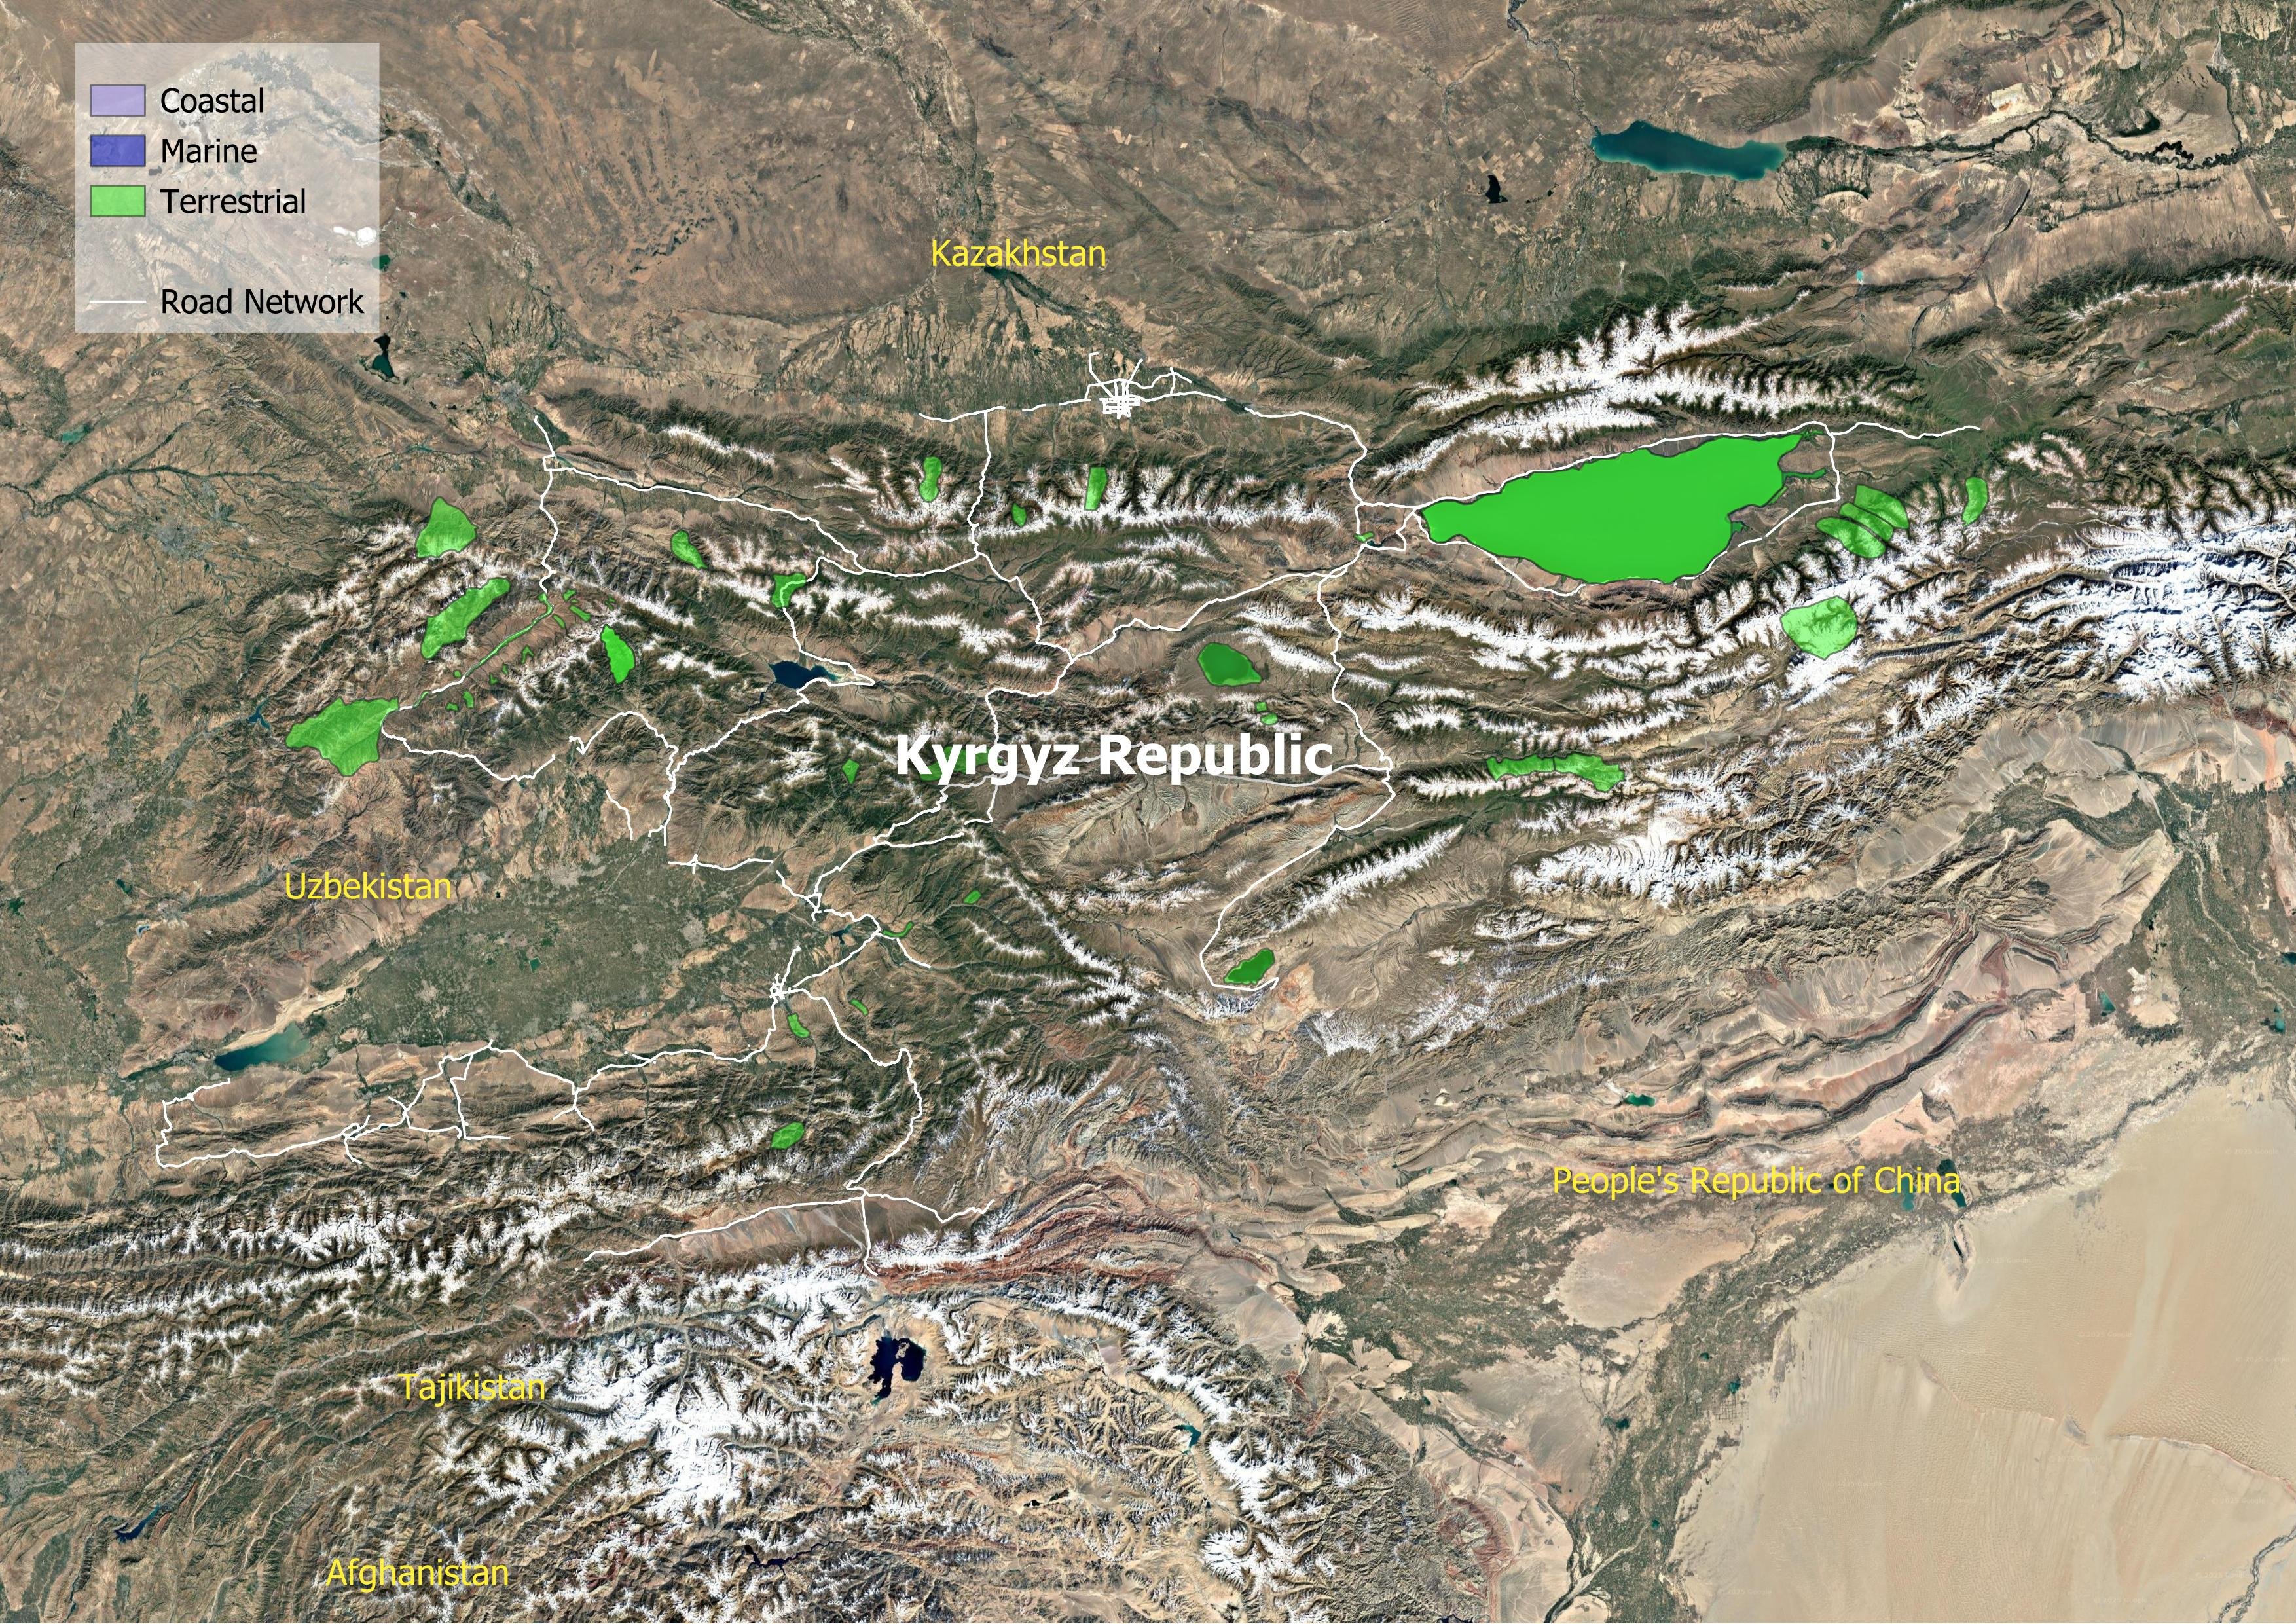
Preserving Biodiversity
Sustainable Materials Sourcing and Construction Practices
Improving Quality of life
Disaster Preparedness
Fostering Inclusive Growth
Supporting Information
Road Infrastructure Pipeline
| Central Asia Regional Economic Cooperation Corridors 1 and 3 Connector Road Project | 2015 | 237.12 million USD | None |
| Issyk-Kul Ring Road Improvement Project (Barskoon–Karakol Section) | 2024 | 137.04 million USD | 79 |
Road User Charging
| Actual maintenance budget | 39 |
| Required maintenance budget | 126 |
| Maintenance budget deficit | 87 |
| Fuel excise tax | 72 |
| Vehicle customs duty | 75 |
| Vehicle registration fee | 7.1 |
| Vehicle value added tax | 15.5 |
| Annual motor vehicle tax | 12.6 |
| Overloaded and oversized vehicles | 1.6 |
| Tolling | 0.9 |
Unit Cost Road Projects
Road Transport Policy Landscape
Road Transport Policy Targets
No data
Road Transport Policy Measure Types
References
AIIB. (n.d.). MEASURING TRANSPORT CONNECTIVITY FOR TRADE IN ASIA. https://impact.economist.com/perspectives/sites/default/files/eco141_aiib_transport_connectivity_4.pdf/
Asian Transport Observatory. (2025). Asia and the Pacific's Transport Infrastructure and Investment Outlook 2035. https://asiantransportobservatory.org/analytical-outputs/asia-transport-infrastructure-investment-needs/
Barrington-Leigh, C., & Millard-Ball, A. (2025). A high-resolution global time series of street-network sprawl. https://journals.sagepub.com/doi/10.1177/23998083241306829
CDRI. (2023). Global Infrastructure Risk Model and Resilience Index. https://giri.unepgrid.ch/
CIESIN. (2023a). Rural Access Index [Dataset]. https://sedac.ciesin.columbia.edu/data/set/sdgi-9-1-1-rai-2023
CIESIN. (2023b). SDG Indicator 11.2.1: Urban Access to Public Transport, 2023 Release: Sustainable Development Goal Indicators (SDGI). https://sedac.ciesin.columbia.edu/data/set/sdgi-11-2-1-urban-access-public-transport-2023
EDGAR. (2025). GHG emissions of all world countries: 2025. Publications Office. https://data.europa.eu/doi/10.2760/9816914
Ember. (2024). Electricity Data Explorer [Dataset]. https://ember-energy.org/data/electricity-data-explorer
EM-DAT. (2025). EM-DAT - The international disaster database. https://www.emdat.be/European Commission. (2024). Global Air Pollutant Emissions EDGAR v8.1 [Dataset]. https://edgar.jrc.ec.europa.eu/dataset_ap61#sources
IEA. (n.d.). Fossil Fuel Subsidies. IEA. Retrieved April 19, 2025, from https://www.iea.org/topics/fossil-fuel-subsidies
ILO. (2025). ILOSTAT [Dataset]. https://rplumber.ilo.org/files/website/bulk/indicator.html
ITDP. (2024). The Atlas of Sustainable City Transport. https://atlas.itdp.org/
Koks, E., Rozenberg, J., Tariverdi, M., Dickens, B., Fox, C., Ginkel, K. van, & Hallegatte, S. (2023). A global assessment of national road network vulnerability. Environmental Research: Infrastructure and Sustainability, 3(2), 025008. https://doi.org/10.1088/2634-4505/acd1aa
Liu, K., Wang, Q., Wang, M., & Koks, E. E. (2023). Global transportation infrastructure exposure to the change of precipitation in a warmer world. Nature Communications, 14(1), 2541. https://doi.org/10.1038/s41467-023-38203-3
McDuffie, E. E., Martin, R. V., Spadaro, J. V., Burnett, R., Smith, S. J., O'Rourke, P., Hammer, M. S., van Donkelaar, A., Bindle, L., Shah, V., Jaeglé, L., Luo, G., Yu, F., Adeniran, J. A., Lin, J., & Brauer, M. (2021). Source sector and fuel contributions to ambient PM2.5 and attributable mortality across multiple spatial scales. Nature Communications, 12(1), 3594. https://doi.org/10.1038/s41467-021-23853-y
Parry, S. B., Antung A. Liu,Ian W. H. (2023). IMF Fossil Fuel Subsidies Data: 2023 Update. IMF. https://www.imf.org/en/publications/wp/issues/2023/08/22/imf-fossil-fuel-subsidies-data-2023-update-537281
Simkins, A. T., Beresford, A. E., Buchanan, G. M., Crowe, O., Elliott, W., Izquierdo, P., Patterson, D. J., & Butchart, S. H. M. (2023). A global assessment of the prevalence of current and potential future infrastructure in Key Biodiversity Areas. Biological Conservation, 281, 109953. https://doi.org/10.1016/j.biocon.2023.109953
Sims, M., Stanimirova, R., Neumann, M., Raichuk, A., & Purves, D. (2025). New Data Shows What's Driving Forest Loss Around the World. https://www.wri.org/insights/forest-loss-drivers-data-trends
Trademap. (2025). Trade Map. Trade Map. https://www.trademap.org/Index.aspx
UN DESA. (n.d.). Economic and Environmental Vulnerability Indicators. Retrieved January 26, 2026, from https://policy.desa.un.org/themes/least-developed-countries-category/ldc-identification-criteria-indicators/evi-indicators
UN DESA. (2025). 2024 Revision of World Population Prospects. https://population.un.org/wpp/
UN Energy Statistics. (2025). Energy Balance Visualization [Dataset]. https://unstats.un.org/unsd/energystats/dataPortal/
UNEP. (2021, May 12). Domestic material consumption (DMC) and DMC per capita, per GDP (Tier I). https://www.unep.org/indicator-1222
Weiss, D. J., Nelson, A., Gibson, H. S., Temperley, W., Peedell, S., Lieber, A., Hancher, M., Poyart, E., Belchior, S., Fullman, N., Mappin, B., Dalrymple, U., Rozier, J., Lucas, T. C. D., Howes, R. E., Tusting, L. S., Kang, S. Y., Cameron, E., Bisanzio, D., … Gething, P. W. (2018). A global map of travel time to cities to assess inequalities in accessibility in 2015. Nature, 553(7688), 333-336. https://doi.org/10.1038/nature25181
WHO. (2023). Global Status Report on Road Safety 2023. https://www.who.int/teams/social-determinants-of-health/safety-and-mobility/global-status-report-on-road-safety-2023
Wiedenhofer, D., Baumgart, A., Matej, S., Virág, D., Kalt, G., Lanau, M., Tingley, D. D., Liu, Z., Guo, J., Tanikawa, H., & Haberl, H. (2024). Mapping and modelling global mobility infrastructure stocks, material flows and their embodied greenhouse gas emissions [Dataset]. https://doi.org/10.1016/j.jclepro.2023.139742
World Bank. (2021). ICP 2021. https://databank.worldbank.org/source/icp-2021
World Bank. (2022a). Annual freshwater withdrawals, total (% of internal resources) [Dataset]. https://data.worldbank.org
World Bank. (2022b). Land area (sq. Km) [Dataset]. https://data.worldbank.org
World Bank. (2022c). The Global Health Cost of PM2.5 Air Pollution: A Case for Action Beyond 2021. The World Bank. https://doi.org/10.1596/978-1-4648-1816-5
World Bank. (2023). Forest area (% of land area) [Dataset]. https://data.worldbank.org/indicator/AG.LND.FRST.ZS
World Bank. (2024). Home | Logistics Performance Index (LPI). Logistics Performance Index. https://lpi.worldbank.org/
World Bank. (2025a). GDP per capita, PPP (current international $) [Dataset]. https://data.worldbank.org/indicator/NY.GDP.PCAP.PP.CD
World Bank. (2025b). GDP, PPP (current international $) [Dataset]. https://data.worldbank.org/indicator/NY.GDP.MKTP.PP.CD
World Database on Protected Areas. (2024). Protected Areas (WDPA) [Dataset]. https://www.protectedplanet.net/en/thematic-areas/wdpa?tab=WDPA