
Kazakhstan Green Roads Profile 2025
KAZAKHSTAN
GREEN ROADS PROFILESupported by:
The ATO green roads profiles present country-level perspectives on how 35 Asia-Pacific economies are addressing the development and management of sustainable eco-friendly roads. Drawing from diverse datasets and policy documents, the profiles highlight practices and measures that contribute to greener transport infrastructure.
Developed by the Asian Transport Observatory (ATO) in partnership with the International Road Federation (IRF), the profiles are designed to complement the Green Roads Toolkit. The toolkit provides a practical reference for integrating good practices across nine dimensions:
- Decarbonization
- Climate resilience
- Water and land management
- Pollution reduction
- Conserving biodiversity
- Responsible sourcing of materials
- Improving quality of life
- Disaster preparedness
- Fostering inclusive growth
This 2025 edition builds on earlier work to provide a comprehensive resource for guiding the planning, development, construction, and management of greener, more sustainable roads.
Background
Indicator - Dimension Matrix

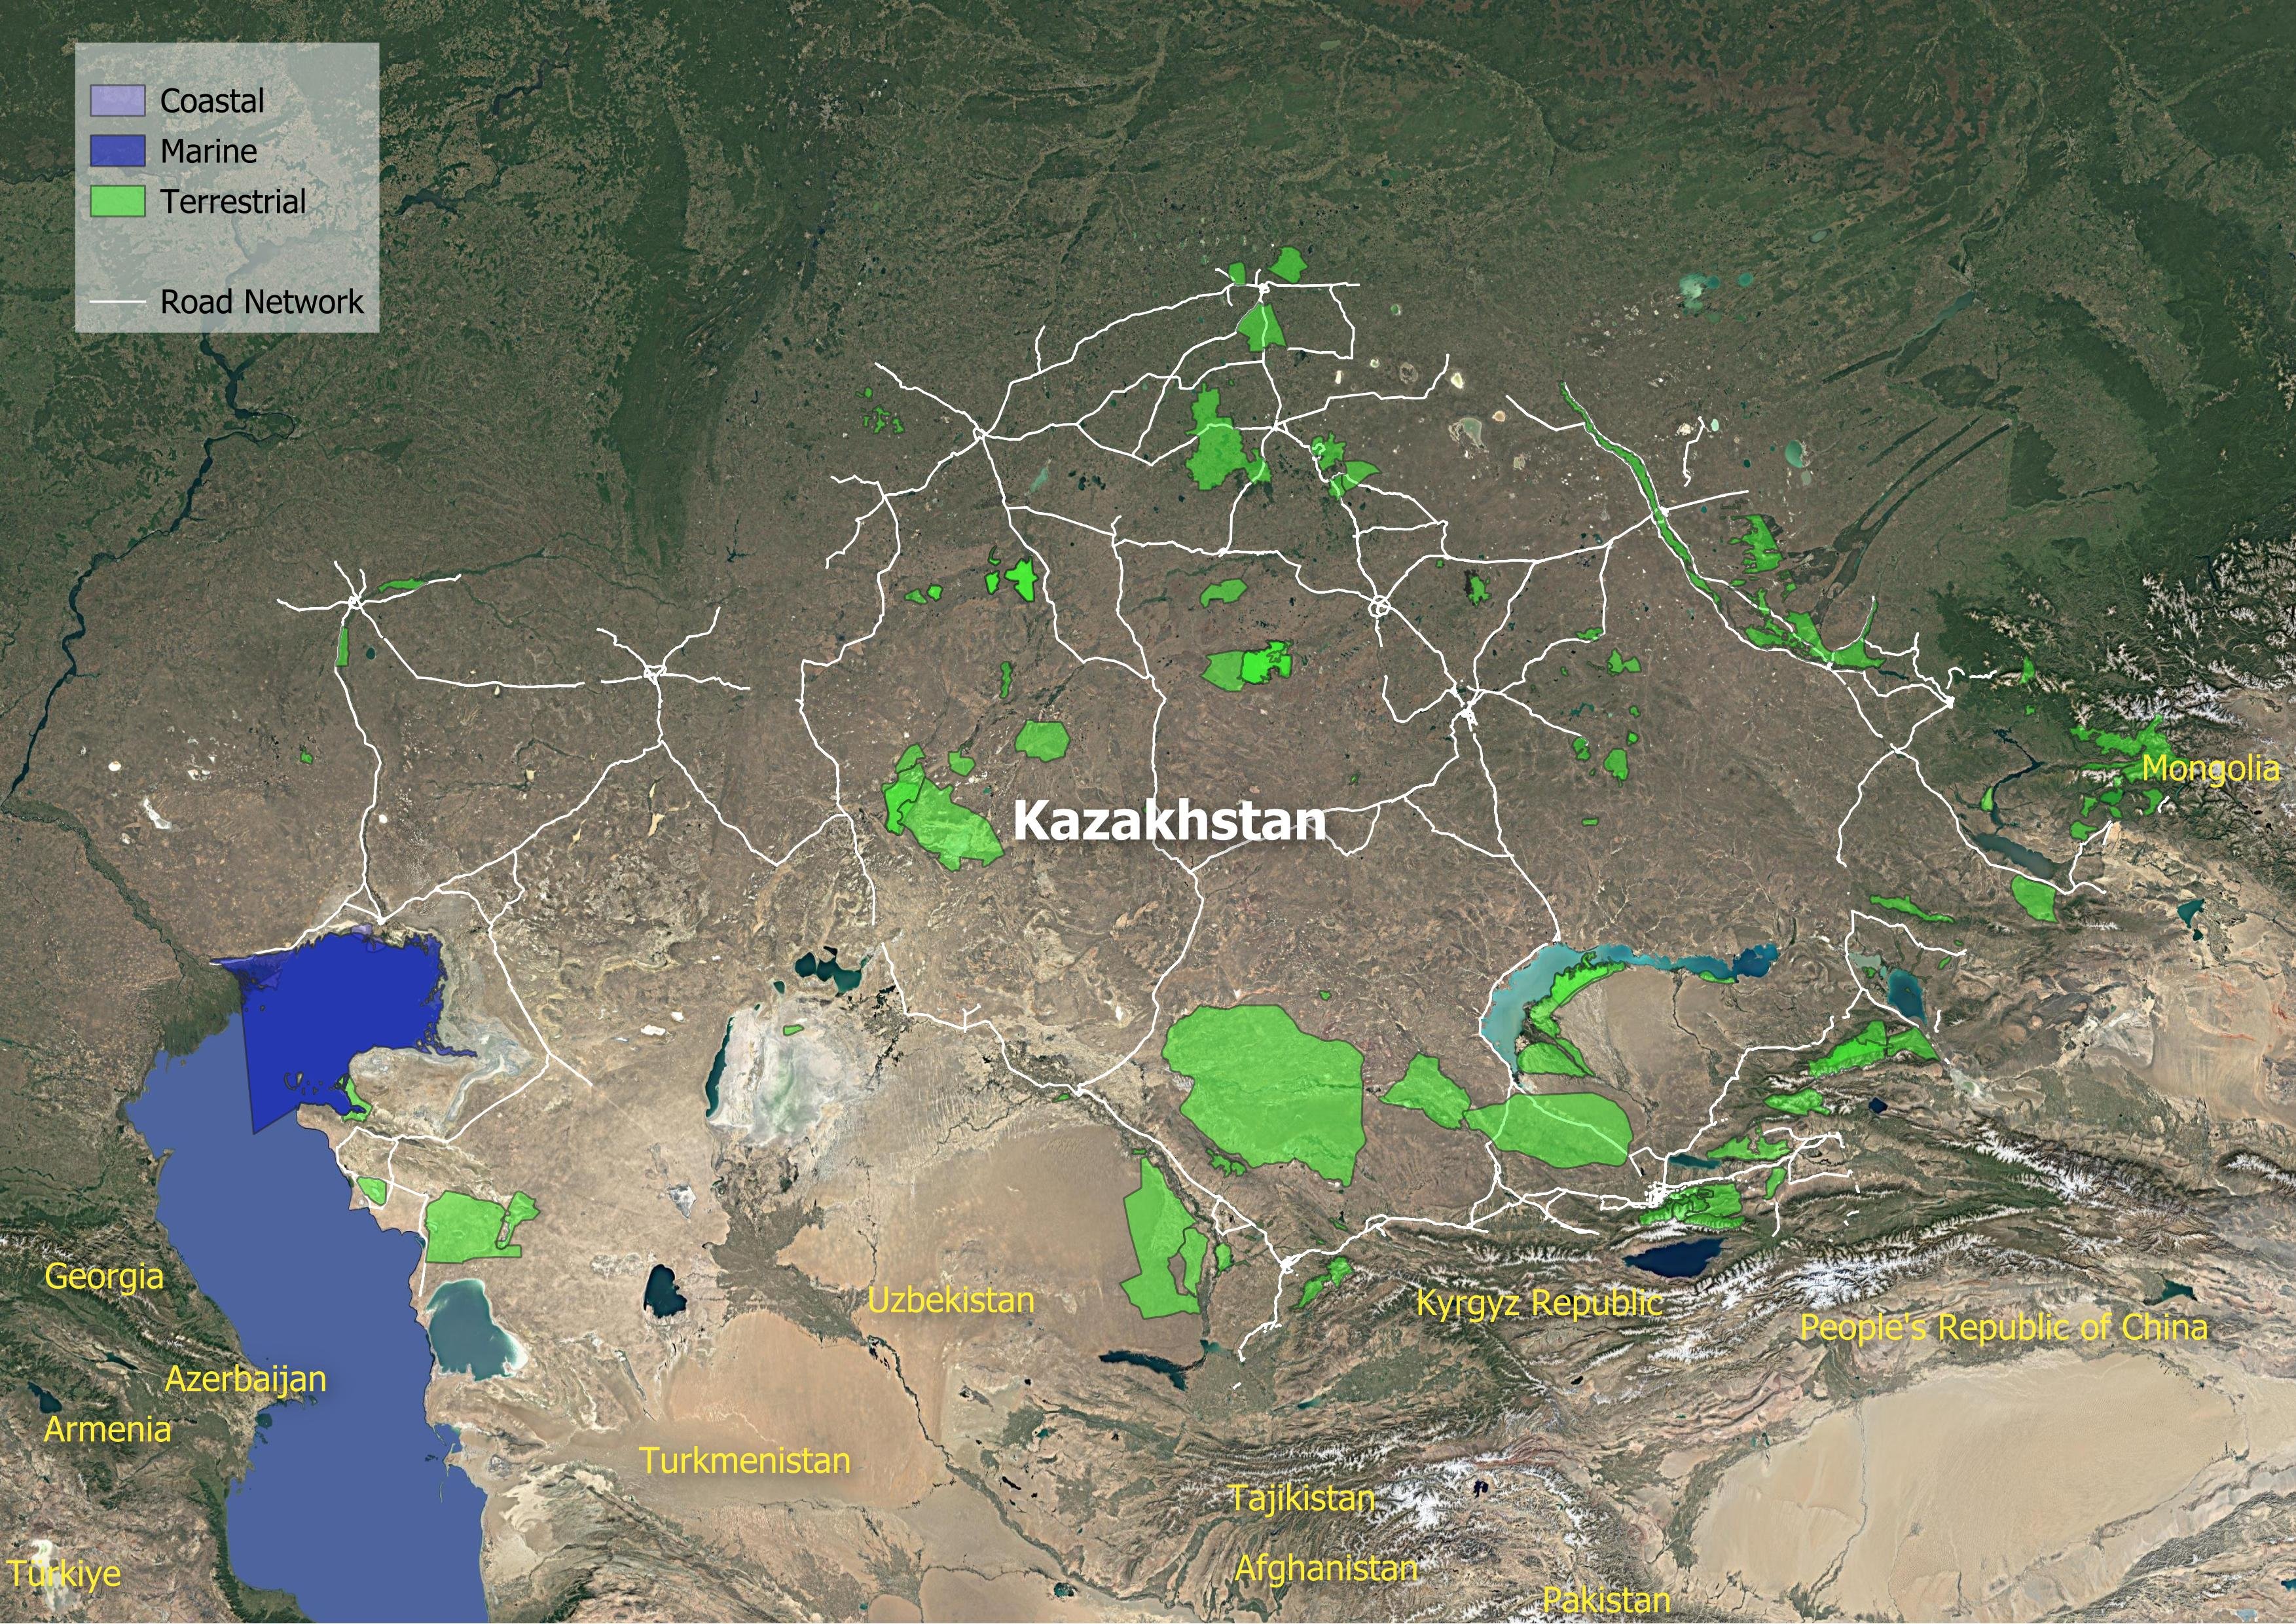
Kazakhstan spans approximately 2.7 million square kilometers, making it a vast land where distance influences the economy. With a population of 20.6 million in 2024, the main challenge isn't just connectivity but maintaining such an extensive infrastructure. The network includes 227,000 kilometers of roads, of which 87% are local and rural, while only 5% are motorways or primary highways. Infrastructure density is sparse, at just 84 meters per square kilometer. In this landlocked region, roads often serve as the first and last-mile critical link.
However, the system faces pressure. Motor vehicle use is increasing, though it hasn't yet matched the saturation of neighboring countries. Kazakhstan has 245 vehicles per 1,000 people, below the Asia-Pacific average of 317. Unfortunately, these vehicles are often polluting. Road transport emitted 25.8 million tonnes of CO2 equivalent greenhouse gases in 2024. The trend is concerning. Since 2000, overall economic emissions grew by 2.7% annually, but road transport emissions increased even faster, at 4.9% per year. Currently, this sector makes up 82% of all transport-related emissions.
Efficiency is stalling. The carbon intensity of moving goods and people—measured at 31 grams of CO2e per USD of GDP—remains higher than the Asia-Pacific average of 26. Improvement is sluggish. Since 2015, intensity improved by a mere 1.3% annually, a figure that pales against the 5.4% gains seen across the broader Asia-Pacific region. The cause is partly economic. Between 2016 and 2023, fossil fuel subsidies in transport increased to $17.4 billion. Subsidised fuel encourages consumption. It also hides the true cost of mobility. Society pays the bill elsewhere: in road crashes (41% of external costs), congestion (57%), and physical damage to the roads themselves.
The air is thick with consequence. The health burden is immediate. At least 550 people die prematurely each year due to exposure to tailpipe emissions and ozone. The World Bank estimates the cost of health damages from ambient and household PM 2.5 exposure at roughly 7% of the country's GDP. This is an expensive way to move.
Safety remains a critical failure. The road kills 2,340 people annually according to 2021 estimates. The economic burden of road crashes in Kazakhstan is substantial. Fatalities and serious injuries cost approximately 7 billion USD in 2021, representing roughly 4% of the country's GDP. For context, this exceeds healthcare expenditure of 3.9% of GDP in the same year.
Climate change threatens to unravel the network further. The infrastructure is exposed. Under a 4.5-degree warming scenario, more than 58% of Kazakhstan's road and rail assets face the risk of more frequent and extreme precipitation. Already, the country faces potential average annual losses of $32.1 million to transport infrastructure. Bridges and tunnels, though a fraction of the network length, bear a disproportionate 1.9% of these losses.
Kazakhstan's biodiversity is rich but vulnerable. Research indicates that roads now dissect 78 of the country's 125 Key Biodiversity Areas. This equates to 21 meters of road for every thousand square kilometers of protected land. While this is lower than the Asia-Pacific average of 88 meters, the encroachment is real. The United Nations Environment Programme flags that 45 active road projects, spanning over 4,000 kilometers, currently endanger significant carbon stocks and nitrogen retention capabilities.
There is a flicker of transition. Electric vehicle imports are growing, reaching a value of $305 million between 2015 and 2024. By 2024, EVs made up 4% of total vehicle imports. However, the grid that powers them is heavy with carbon, emitting 802 grams of CO2 per kilowatt-hour—significantly dirtier than the Asia-Pacific average of 559. A clean car on a dirty grid is only half a solution. UNEP's E-mobility Readiness Index gives the country a score of 59 out of 100, citing weak policy frameworks and financial incentives as major hurdles.
Access remains unequal. In the cities, 77% of the population must travel more than 30 minutes to reach key centers. Only 54% of the urban population has access to healthcare and education within a reasonable distance. In the countryside, 2.9 million people live beyond the reach of an all-season road. Isolation leaves them vulnerable to economic shocks and slows recovery when disaster strikes.
Kazakhstan stands at a difficult crossroads. The physical scale of the country demands a robust road network, yet the current model of expansion is environmentally costly and economically inefficient. Subsidies distort the market, keeping the fleet old and the emissions high. While the region races toward decarbonization, Kazakhstan's improvements in emissions intensity are lagging. The road network is a lifeline for millions, but it is also a source of significant public health burden and financial loss.
Decarbonization
Climate Resilience
Water and Land Management
Reducing Pollution
Preserving Biodiversity
Sustainable Materials Sourcing and Construction Practices
Improving Quality of life
Disaster Preparedness
Fostering Inclusive Growth
Supporting Information
Road Infrastructure Pipeline
| BAKAD Road Concession | 2019 | None | None |
| Central Asia Regional Economic Cooperation Corridors 1 and 6 Connector Road (Aktobe–Kandyagash) Reconstruction Project | 2019 | 229.35 million USD | None |
| Central Asia Regional Economic Cooperation Corridors 1, 2, and 6 Connector Road (Kyzylorda–Zhezkazgan) Reconstruction Project | 2024 | 354.53 million USD | 208 |
| Central Asia Regional Economic Cooperation Corridors 3 and 6 Turkistan Oblast Highway (Saryagash Bypass) Project | 2025 | None | None |
| KAZ: Bakad PPP Toll Road Project | 2019 | None | 66 |
| Kazakhstan: Reconstruction of M-32 Highway Aktobe-Karabutak-Ulgaisyn Section Project | - | None | 234 |
| Kazakhstan: Transport Resilience and Connectivity Enhancement Project (Jezkazgan-Karagandy section of Trans-Caspian International Transport Route (Middle Corridor)) (Previously: Strategic Road Connectivity and Sector Modernization Project) | 2024 | None | None |
| Kyzylorda-Zhezkazgan Road Reconstruction | 2020 | None | None |
| Road Maintenance Sustainability Project | 2023 | None | 161 |
| Transport Resilience and Connectivity Enhancement Project (Jezkazgan-Karagandy Section of TCITR (Middle Corridor)) | 2024 | None | None |
Unit Cost Road Projects
Road Transport Policy Landscape
Road Transport Policy Targets
No data
Road Transport Policy Measure Types
References
AIIB. (n.d.). MEASURING TRANSPORT CONNECTIVITY FOR TRADE IN ASIA. https://impact.economist.com/perspectives/sites/default/files/eco141_aiib_transport_connectivity_4.pdf/
Asian Transport Observatory. (2025). Asia and the Pacific's Transport Infrastructure and Investment Outlook 2035. https://asiantransportobservatory.org/analytical-outputs/asia-transport-infrastructure-investment-needs/
Barrington-Leigh, C., & Millard-Ball, A. (2025). A high-resolution global time series of street-network sprawl. https://journals.sagepub.com/doi/10.1177/23998083241306829
CDRI. (2023). Global Infrastructure Risk Model and Resilience Index. https://giri.unepgrid.ch/
CIESIN. (2023a). Rural Access Index [Dataset]. https://sedac.ciesin.columbia.edu/data/set/sdgi-9-1-1-rai-2023
CIESIN. (2023b). SDG Indicator 11.2.1: Urban Access to Public Transport, 2023 Release: Sustainable Development Goal Indicators (SDGI). https://sedac.ciesin.columbia.edu/data/set/sdgi-11-2-1-urban-access-public-transport-2023
EDGAR. (2025). GHG emissions of all world countries: 2025. Publications Office. https://data.europa.eu/doi/10.2760/9816914
Ember. (2024). Electricity Data Explorer [Dataset]. https://ember-energy.org/data/electricity-data-explorer
EM-DAT. (2025). EM-DAT - The international disaster database. https://www.emdat.be/European Commission. (2024). Global Air Pollutant Emissions EDGAR v8.1 [Dataset]. https://edgar.jrc.ec.europa.eu/dataset_ap61#sources
IEA. (n.d.). Fossil Fuel Subsidies. IEA. Retrieved April 19, 2025, from https://www.iea.org/topics/fossil-fuel-subsidies
ILO. (2025). ILOSTAT [Dataset]. https://rplumber.ilo.org/files/website/bulk/indicator.html
ITDP. (2024). The Atlas of Sustainable City Transport. https://atlas.itdp.org/
Koks, E., Rozenberg, J., Tariverdi, M., Dickens, B., Fox, C., Ginkel, K. van, & Hallegatte, S. (2023). A global assessment of national road network vulnerability. Environmental Research: Infrastructure and Sustainability, 3(2), 025008. https://doi.org/10.1088/2634-4505/acd1aa
Liu, K., Wang, Q., Wang, M., & Koks, E. E. (2023). Global transportation infrastructure exposure to the change of precipitation in a warmer world. Nature Communications, 14(1), 2541. https://doi.org/10.1038/s41467-023-38203-3
McDuffie, E. E., Martin, R. V., Spadaro, J. V., Burnett, R., Smith, S. J., O'Rourke, P., Hammer, M. S., van Donkelaar, A., Bindle, L., Shah, V., Jaeglé, L., Luo, G., Yu, F., Adeniran, J. A., Lin, J., & Brauer, M. (2021). Source sector and fuel contributions to ambient PM2.5 and attributable mortality across multiple spatial scales. Nature Communications, 12(1), 3594. https://doi.org/10.1038/s41467-021-23853-y
Parry, S. B., Antung A. Liu,Ian W. H. (2023). IMF Fossil Fuel Subsidies Data: 2023 Update. IMF. https://www.imf.org/en/publications/wp/issues/2023/08/22/imf-fossil-fuel-subsidies-data-2023-update-537281
Simkins, A. T., Beresford, A. E., Buchanan, G. M., Crowe, O., Elliott, W., Izquierdo, P., Patterson, D. J., & Butchart, S. H. M. (2023). A global assessment of the prevalence of current and potential future infrastructure in Key Biodiversity Areas. Biological Conservation, 281, 109953. https://doi.org/10.1016/j.biocon.2023.109953
Sims, M., Stanimirova, R., Neumann, M., Raichuk, A., & Purves, D. (2025). New Data Shows What's Driving Forest Loss Around the World. https://www.wri.org/insights/forest-loss-drivers-data-trends
Trademap. (2025). Trade Map. Trade Map. https://www.trademap.org/Index.aspx
UN DESA. (n.d.). Economic and Environmental Vulnerability Indicators. Retrieved January 26, 2026, from https://policy.desa.un.org/themes/least-developed-countries-category/ldc-identification-criteria-indicators/evi-indicators
UN DESA. (2025). 2024 Revision of World Population Prospects. https://population.un.org/wpp/
UN Energy Statistics. (2025). Energy Balance Visualization [Dataset]. https://unstats.un.org/unsd/energystats/dataPortal/
UNEP. (2021, May 12). Domestic material consumption (DMC) and DMC per capita, per GDP (Tier I). https://www.unep.org/indicator-1222
Weiss, D. J., Nelson, A., Gibson, H. S., Temperley, W., Peedell, S., Lieber, A., Hancher, M., Poyart, E., Belchior, S., Fullman, N., Mappin, B., Dalrymple, U., Rozier, J., Lucas, T. C. D., Howes, R. E., Tusting, L. S., Kang, S. Y., Cameron, E., Bisanzio, D., … Gething, P. W. (2018). A global map of travel time to cities to assess inequalities in accessibility in 2015. Nature, 553(7688), 333-336. https://doi.org/10.1038/nature25181
WHO. (2023). Global Status Report on Road Safety 2023. https://www.who.int/teams/social-determinants-of-health/safety-and-mobility/global-status-report-on-road-safety-2023
Wiedenhofer, D., Baumgart, A., Matej, S., Virág, D., Kalt, G., Lanau, M., Tingley, D. D., Liu, Z., Guo, J., Tanikawa, H., & Haberl, H. (2024). Mapping and modelling global mobility infrastructure stocks, material flows and their embodied greenhouse gas emissions [Dataset]. https://doi.org/10.1016/j.jclepro.2023.139742
World Bank. (2021). ICP 2021. https://databank.worldbank.org/source/icp-2021
World Bank. (2022a). Annual freshwater withdrawals, total (% of internal resources) [Dataset]. https://data.worldbank.org
World Bank. (2022b). Land area (sq. Km) [Dataset]. https://data.worldbank.org
World Bank. (2022c). The Global Health Cost of PM2.5 Air Pollution: A Case for Action Beyond 2021. The World Bank. https://doi.org/10.1596/978-1-4648-1816-5
World Bank. (2023). Forest area (% of land area) [Dataset]. https://data.worldbank.org/indicator/AG.LND.FRST.ZS
World Bank. (2024). Home | Logistics Performance Index (LPI). Logistics Performance Index. https://lpi.worldbank.org/
World Bank. (2025a). GDP per capita, PPP (current international $) [Dataset]. https://data.worldbank.org/indicator/NY.GDP.PCAP.PP.CD
World Bank. (2025b). GDP, PPP (current international $) [Dataset]. https://data.worldbank.org/indicator/NY.GDP.MKTP.PP.CD
World Database on Protected Areas. (2024). Protected Areas (WDPA) [Dataset]. https://www.protectedplanet.net/en/thematic-areas/wdpa?tab=WDPA