
Indonesia Green Roads Profile 2025
INDONESIA
GREEN ROADS PROFILESupported by:
The ATO green roads profiles present country-level perspectives on how 35 Asia-Pacific economies are addressing the development and management of sustainable eco-friendly roads. Drawing from diverse datasets and policy documents, the profiles highlight practices and measures that contribute to greener transport infrastructure.
Developed by the Asian Transport Observatory (ATO) in partnership with the International Road Federation (IRF), the profiles are designed to complement the Green Roads Toolkit. The toolkit provides a practical reference for integrating good practices across nine dimensions:
- Decarbonization
- Climate resilience
- Water and land management
- Pollution reduction
- Conserving biodiversity
- Responsible sourcing of materials
- Improving quality of life
- Disaster preparedness
- Fostering inclusive growth
This 2025 edition builds on earlier work to provide a comprehensive resource for guiding the planning, development, construction, and management of greener, more sustainable roads.
Background
Indicator - Dimension Matrix

Indonesia, an archipelago characterized by water yet connected by asphalt, spans 1.9 million square kilometers and aims to unite its 283.5 million people into one economic entity. The country has developed a road network of 1.3 million kilometers, predominantly local and rural roads making up 92% of the infrastructure. The main challenge is density. While OECD nations have an average of 17 kilometers of road per thousand people, Indonesia's figure has risen from 3.7 in 2000 to just 4.5 today, despite recent expansion efforts. The infrastructure struggles to meet the growing demand for mobility. Motor vehicles have increased to 528 per thousand people, far above the Asia-Pacific average of 317, with most growth seen in two-wheelers. The fleet's composition influences the energy footprint: Indonesia's roads are mainly motorcycles, comprising 82% of traffic, with light-duty vehicles at 10% and buses at 2%. This fleet structure results in relatively low emissions—29 grams of CO2e per dollar of GDP—compared to Southeast Asia's average of 31.
Yet, the aggregate burden grows. The road sector emitted 135.7 million tonnes of CO2e in 2024, representing 88% of all transport emissions. Since 2000, these emissions have climbed 3.7% annually. The efficiency gains are real, but they are being swamped by volume.
Policy creates distortions. Between 2016 and 2023, the state provided $117.6 billion into fossil fuel subsidies. This subsidy masks the true cost of mobility, which society pays elsewhere: in congestion, in road damage, and in blood. The external costs of this subsidized travel are staggering, with road crashes accounting for 61% of the societal burden.
The transition to electric mobility offers an escape, but the path is steep. Indonesia scores well on readiness—86 out of 100 on UNEP's index. However, an electric vehicle is only as clean as the power plant behind it. Indonesia's grid emission factor sits at 680 gCO2 per kWh, significantly dirtier than the Asia-Pacific average of 559. While EV imports have reached $2 billion since 2015.
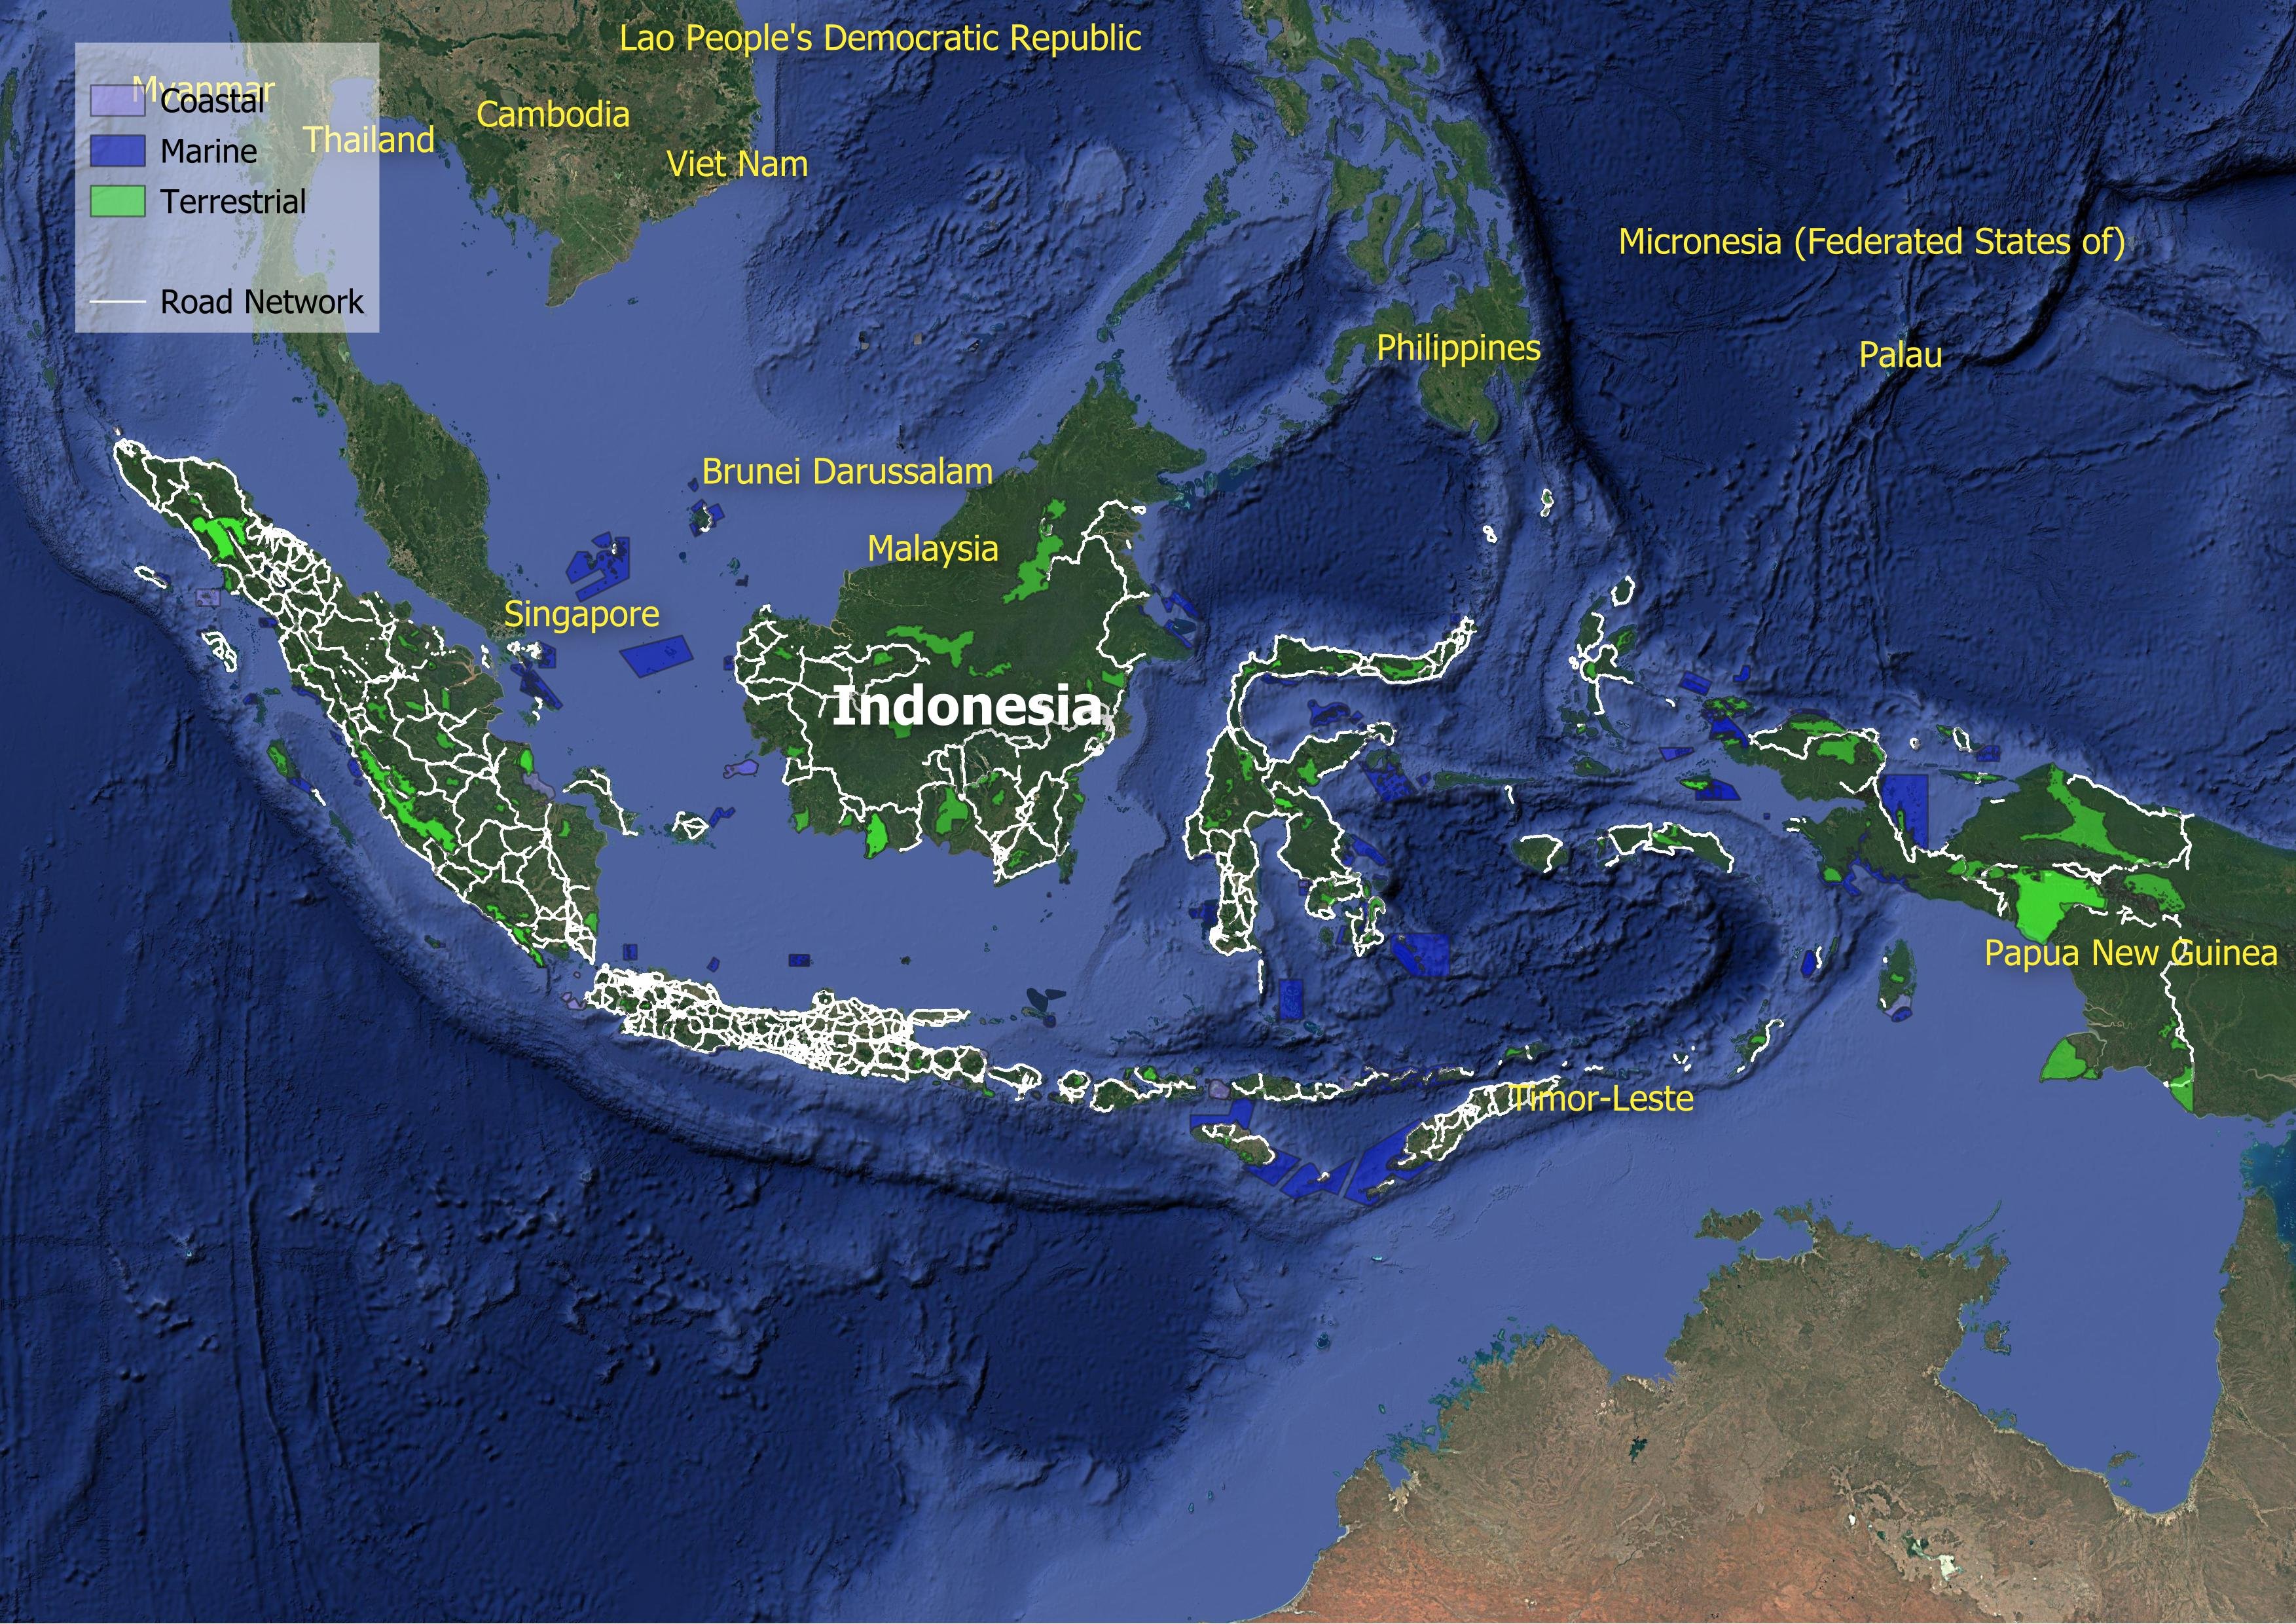
Roads now penetrate 249 of the country's 430 Key Biodiversity Areas. The conflict between infrastructure and environment is not just ecological; it is financial. Climate hazards exact a toll of $761.3 million annually in infrastructure losses, with roads absorbing 95% of that damage. Under a 4.5-degree warming scenario, nearly a third of all road assets will face exposure to extreme precipitation.
The air in the cities has become a hazard. The transport sector emits 56.1 thousand tonnes of PM 2.5 into the atmosphere. The World Bank estimates the health damages from ambient PM 2.5 exposure at $220.1 billion—roughly 7% of GDP. The road network is failing to protect the vulnerable. In 2021, the WHO estimated 31,063 road crash fatalities. In Indonesia, road crash fatalities decreased by approximately -0.7% per year between 2016 and 2021. However, this is not enough to reach the 2030 target to halve the fatalities by 2030.
Over 31 million rural residents remain cut off from all-season roads, isolated from markets and hospitals. In the cities, 82% of urban centers fail to provide public transport access to the majority of their residents. Mobility is expensive, consuming 12% of household expenditures , and it remains a male domain; women constitute a mere 6.9% of the transport workforce.
Indonesia faces an uncertain path ahead. Its mobility system depends on a fragile balance: substantial fossil fuel subsidies, a high-carbon energy grid, and infrastructure that threatens vital biodiversity while being susceptible to climate shocks. The current trend—characterized by rapid motorization and high external costs—indicates that unless there is a shift toward cleaner energy, resilient infrastructure, and inclusive access, the long-term costs of development could surpass the benefits.
Decarbonization
Climate Resilience
Water and Land Management
Reducing Pollution
Preserving Biodiversity
Sustainable Materials Sourcing and Construction Practices
Improving Quality of life
Disaster Preparedness
Fostering Inclusive Growth
Supporting Information
Road Infrastructure Pipeline
| Indonesia: Batam Bintan Bridge Project | - | None | None |
| Indonesia: Trans-Sumatra Toll Road Project – Cinto Kenang to Sentjalang | - | None | None |
| Patimban Access Toll Road Construction Project | 2023 | None | None |
| Trans South-South Java Road Project | 2025 | None | 72 |
| Trans-Papua Highway (Sorong–Merauke) | 2005 | None | 4325 |
| Trans-Roads on 18 Disadvantaged, Frontier, and Outermost Islands | 2015 | None | None |
| Trans-Sumatra Toll Road (Aceh–Lampung) | 2012 | 33,200 million USD | 2818 |
| Trans‑Java Toll Road Network | 1983 | None | 1167 |
| Indonesia Road Connectivity Improvement Program to Support Food Self Sufficiency | TBC | 2,250 million USD | TBC |
| Development of Trans South South Java Road Project Phase II | 2025 | 300 million USD | 72 |
| Kalimantan Border Road Development Project | TBC | 922 million USD | TBC |
| Development of Trans South South Java Road Project Phase III | TBC | 496 million USD | TBC |
| Toll Road Development in Sumatera Islands: Jambi - Rengat Section Phase I (Sp. Ness - Merlung)k | TBC | 1,624 million USD | TBC |
| Development of Padang - Pekanbaru Toll Road | TBC | 1,340 million USD | TBC |
| Kalimantan Missing Link Corridor Road Development Project | TBC | 327 million USD | TBC |
| Railways Crossing Improvement Project | TBC | 172 million USD | TBC |
Unit Cost Road Projects
Road Transport Policy Landscape
Road Transport Policy Targets
| Development of National Logistics System Framework | 2025 | •Indonesian LPI Score is 3.5 |
| Visi Indonesia 2045 | 2045 | Infrastructure stock increases to 70 percent of GDP by 2045. |
| National Medium Term Development Plan 2025-2029 | 2029 | National Logistics Costs of the GDP= 12.50% (Baseline 2022 = 14.29%) |
| Ministry of Public Works Strategic Plan 2025-2029 | 2029 | Length of operational toll roads (in km) = 5,134 (Baseline 2024 = 933) |
| Ministry of Public Works Strategic Plan 2025-2029 | 2029 | Percentage of roads in good condition at the national/provincial/regency/city level (%) = 98/76/66/85 (Baseline 2024 = 92/70/53/81) |
| Ministry of Public Works Strategic Plan 2025-2029 | 2029 | Travel time at main corridor in national road (in hour/100 km) = 1.7 hours/ 100 km (Baseline 2024 = 1.9) |
Road Transport Policy Measure Types
References
AIIB. (n.d.). MEASURING TRANSPORT CONNECTIVITY FOR TRADE IN ASIA. https://impact.economist.com/perspectives/sites/default/files/eco141_aiib_transport_connectivity_4.pdf/
Asian Transport Observatory. (2025). Asia and the Pacific's Transport Infrastructure and Investment Outlook 2035. https://asiantransportobservatory.org/analytical-outputs/asia-transport-infrastructure-investment-needs/
Barrington-Leigh, C., & Millard-Ball, A. (2025). A high-resolution global time series of street-network sprawl. https://journals.sagepub.com/doi/10.1177/23998083241306829
CDRI. (2023). Global Infrastructure Risk Model and Resilience Index. https://giri.unepgrid.ch/
CIESIN. (2023a). Rural Access Index [Dataset]. https://sedac.ciesin.columbia.edu/data/set/sdgi-9-1-1-rai-2023
CIESIN. (2023b). SDG Indicator 11.2.1: Urban Access to Public Transport, 2023 Release: Sustainable Development Goal Indicators (SDGI). https://sedac.ciesin.columbia.edu/data/set/sdgi-11-2-1-urban-access-public-transport-2023
EDGAR. (2025). GHG emissions of all world countries: 2025. Publications Office. https://data.europa.eu/doi/10.2760/9816914
Ember. (2024). Electricity Data Explorer [Dataset]. https://ember-energy.org/data/electricity-data-explorer
EM-DAT. (2025). EM-DAT - The international disaster database. https://www.emdat.be/European Commission. (2024). Global Air Pollutant Emissions EDGAR v8.1 [Dataset]. https://edgar.jrc.ec.europa.eu/dataset_ap61#sources
IEA. (n.d.). Fossil Fuel Subsidies. IEA. Retrieved April 19, 2025, from https://www.iea.org/topics/fossil-fuel-subsidies
ILO. (2025). ILOSTAT [Dataset]. https://rplumber.ilo.org/files/website/bulk/indicator.html
ITDP. (2024). The Atlas of Sustainable City Transport. https://atlas.itdp.org/
Koks, E., Rozenberg, J., Tariverdi, M., Dickens, B., Fox, C., Ginkel, K. van, & Hallegatte, S. (2023). A global assessment of national road network vulnerability. Environmental Research: Infrastructure and Sustainability, 3(2), 025008. https://doi.org/10.1088/2634-4505/acd1aa
Liu, K., Wang, Q., Wang, M., & Koks, E. E. (2023). Global transportation infrastructure exposure to the change of precipitation in a warmer world. Nature Communications, 14(1), 2541. https://doi.org/10.1038/s41467-023-38203-3
McDuffie, E. E., Martin, R. V., Spadaro, J. V., Burnett, R., Smith, S. J., O'Rourke, P., Hammer, M. S., van Donkelaar, A., Bindle, L., Shah, V., Jaeglé, L., Luo, G., Yu, F., Adeniran, J. A., Lin, J., & Brauer, M. (2021). Source sector and fuel contributions to ambient PM2.5 and attributable mortality across multiple spatial scales. Nature Communications, 12(1), 3594. https://doi.org/10.1038/s41467-021-23853-y
Parry, S. B., Antung A. Liu,Ian W. H. (2023). IMF Fossil Fuel Subsidies Data: 2023 Update. IMF. https://www.imf.org/en/publications/wp/issues/2023/08/22/imf-fossil-fuel-subsidies-data-2023-update-537281
Simkins, A. T., Beresford, A. E., Buchanan, G. M., Crowe, O., Elliott, W., Izquierdo, P., Patterson, D. J., & Butchart, S. H. M. (2023). A global assessment of the prevalence of current and potential future infrastructure in Key Biodiversity Areas. Biological Conservation, 281, 109953. https://doi.org/10.1016/j.biocon.2023.109953
Sims, M., Stanimirova, R., Neumann, M., Raichuk, A., & Purves, D. (2025). New Data Shows What's Driving Forest Loss Around the World. https://www.wri.org/insights/forest-loss-drivers-data-trends
Trademap. (2025). Trade Map. Trade Map. https://www.trademap.org/Index.aspx
UN DESA. (n.d.). Economic and Environmental Vulnerability Indicators. Retrieved January 26, 2026, from https://policy.desa.un.org/themes/least-developed-countries-category/ldc-identification-criteria-indicators/evi-indicators
UN DESA. (2025). 2024 Revision of World Population Prospects. https://population.un.org/wpp/
UN Energy Statistics. (2025). Energy Balance Visualization [Dataset]. https://unstats.un.org/unsd/energystats/dataPortal/
UNEP. (2021, May 12). Domestic material consumption (DMC) and DMC per capita, per GDP (Tier I). https://www.unep.org/indicator-1222
Weiss, D. J., Nelson, A., Gibson, H. S., Temperley, W., Peedell, S., Lieber, A., Hancher, M., Poyart, E., Belchior, S., Fullman, N., Mappin, B., Dalrymple, U., Rozier, J., Lucas, T. C. D., Howes, R. E., Tusting, L. S., Kang, S. Y., Cameron, E., Bisanzio, D., … Gething, P. W. (2018). A global map of travel time to cities to assess inequalities in accessibility in 2015. Nature, 553(7688), 333-336. https://doi.org/10.1038/nature25181
WHO. (2023). Global Status Report on Road Safety 2023. https://www.who.int/teams/social-determinants-of-health/safety-and-mobility/global-status-report-on-road-safety-2023
Wiedenhofer, D., Baumgart, A., Matej, S., Virág, D., Kalt, G., Lanau, M., Tingley, D. D., Liu, Z., Guo, J., Tanikawa, H., & Haberl, H. (2024). Mapping and modelling global mobility infrastructure stocks, material flows and their embodied greenhouse gas emissions [Dataset]. https://doi.org/10.1016/j.jclepro.2023.139742
World Bank. (2021). ICP 2021. https://databank.worldbank.org/source/icp-2021
World Bank. (2022a). Annual freshwater withdrawals, total (% of internal resources) [Dataset]. https://data.worldbank.org
World Bank. (2022b). Land area (sq. Km) [Dataset]. https://data.worldbank.org
World Bank. (2022c). The Global Health Cost of PM2.5 Air Pollution: A Case for Action Beyond 2021. The World Bank. https://doi.org/10.1596/978-1-4648-1816-5
World Bank. (2023). Forest area (% of land area) [Dataset]. https://data.worldbank.org/indicator/AG.LND.FRST.ZS
World Bank. (2024). Home | Logistics Performance Index (LPI). Logistics Performance Index. https://lpi.worldbank.org/
World Bank. (2025a). GDP per capita, PPP (current international $) [Dataset]. https://data.worldbank.org/indicator/NY.GDP.PCAP.PP.CD
World Bank. (2025b). GDP, PPP (current international $) [Dataset]. https://data.worldbank.org/indicator/NY.GDP.MKTP.PP.CD
World Database on Protected Areas. (2024). Protected Areas (WDPA) [Dataset]. https://www.protectedplanet.net/en/thematic-areas/wdpa?tab=WDPA