
Georgia Green Roads Profile 2025
GEORGIA
GREEN ROADS PROFILESupported by:
The ATO green roads profiles present country-level perspectives on how 35 Asia-Pacific economies are addressing the development and management of sustainable eco-friendly roads. Drawing from diverse datasets and policy documents, the profiles highlight practices and measures that contribute to greener transport infrastructure.
Developed by the Asian Transport Observatory (ATO) in partnership with the International Road Federation (IRF), the profiles are designed to complement the Green Roads Toolkit. The toolkit provides a practical reference for integrating good practices across nine dimensions:
- Decarbonization
- Climate resilience
- Water and land management
- Pollution reduction
- Conserving biodiversity
- Responsible sourcing of materials
- Improving quality of life
- Disaster preparedness
- Fostering inclusive growth
This 2025 edition builds on earlier work to provide a comprehensive resource for guiding the planning, development, construction, and management of greener, more sustainable roads.
Background
Indicator - Dimension Matrix

The Motorization of the Georgia is paving its way to connectivity, but the environmental price tag is rising. The nation's road network, measuring 43.2 thousand kilometers, is the circulatory system of the economy, yet it remains heavily skewed toward the last mile; 91% of this infrastructure consists of local and rural roads. Motorization has increased to 514 vehicles per thousand people, a figure higher than the Asia-Pacific average of 317. The fleet is light-duty dominant (69%), but the presence of a 14% share of two-wheelers suggests a diverse mobility culture.
Road transport in Georgia has become a monopoly on emissions, accounting for 100% of the transport sector's greenhouse gas (GHG) output and a full 21% of the entire economy-wide emissions. The trajectory is steep. Sector emissions have grown by 6.3% annually since 2000, nearly tripling the growth rate of the broader economy. For every dollar of GDP generated, Georgia's road transport emits 39 grams of CO2 equivalent. While this intensity has improved by 7.7% per year since 2015—outperforming the 5.4% improvement seen in the wider Asia-Pacific region—the baseline remains high; the regional average intensity sits lower at 26 grams.
However, the energy infrastructure offers a distinct escape route. Georgia's electricity grid is remarkably clean, with an emission factor of 143 gCO2 per kWh. This stands in stark contrast to the carbon-heavy grids of Central and West Asia (495 gCO2 per kWh) and the broader Asia-Pacific (559 gCO2 per kWh). The potential for deep decarbonization through electrification is immense, yet it remains dormant. Electric vehicles (EVs) constitute only 4% of total road vehicle imports, and the UNEP E-mobility Readiness Index scores the country a middling 53 out of 100.
Climatological hazards strip an estimated $15.9 million from Georgia's transport infrastructure annually, a recurring tax equivalent to 0.017% of GDP. The future looks wetter and more destructive. Under a 4.5-degree warming scenario, extreme precipitation threatens 17% of the country's road and rail assets. Bridges and tunnels, though only a fraction of the network length, bear a disproportionate 9.8% of these losses.
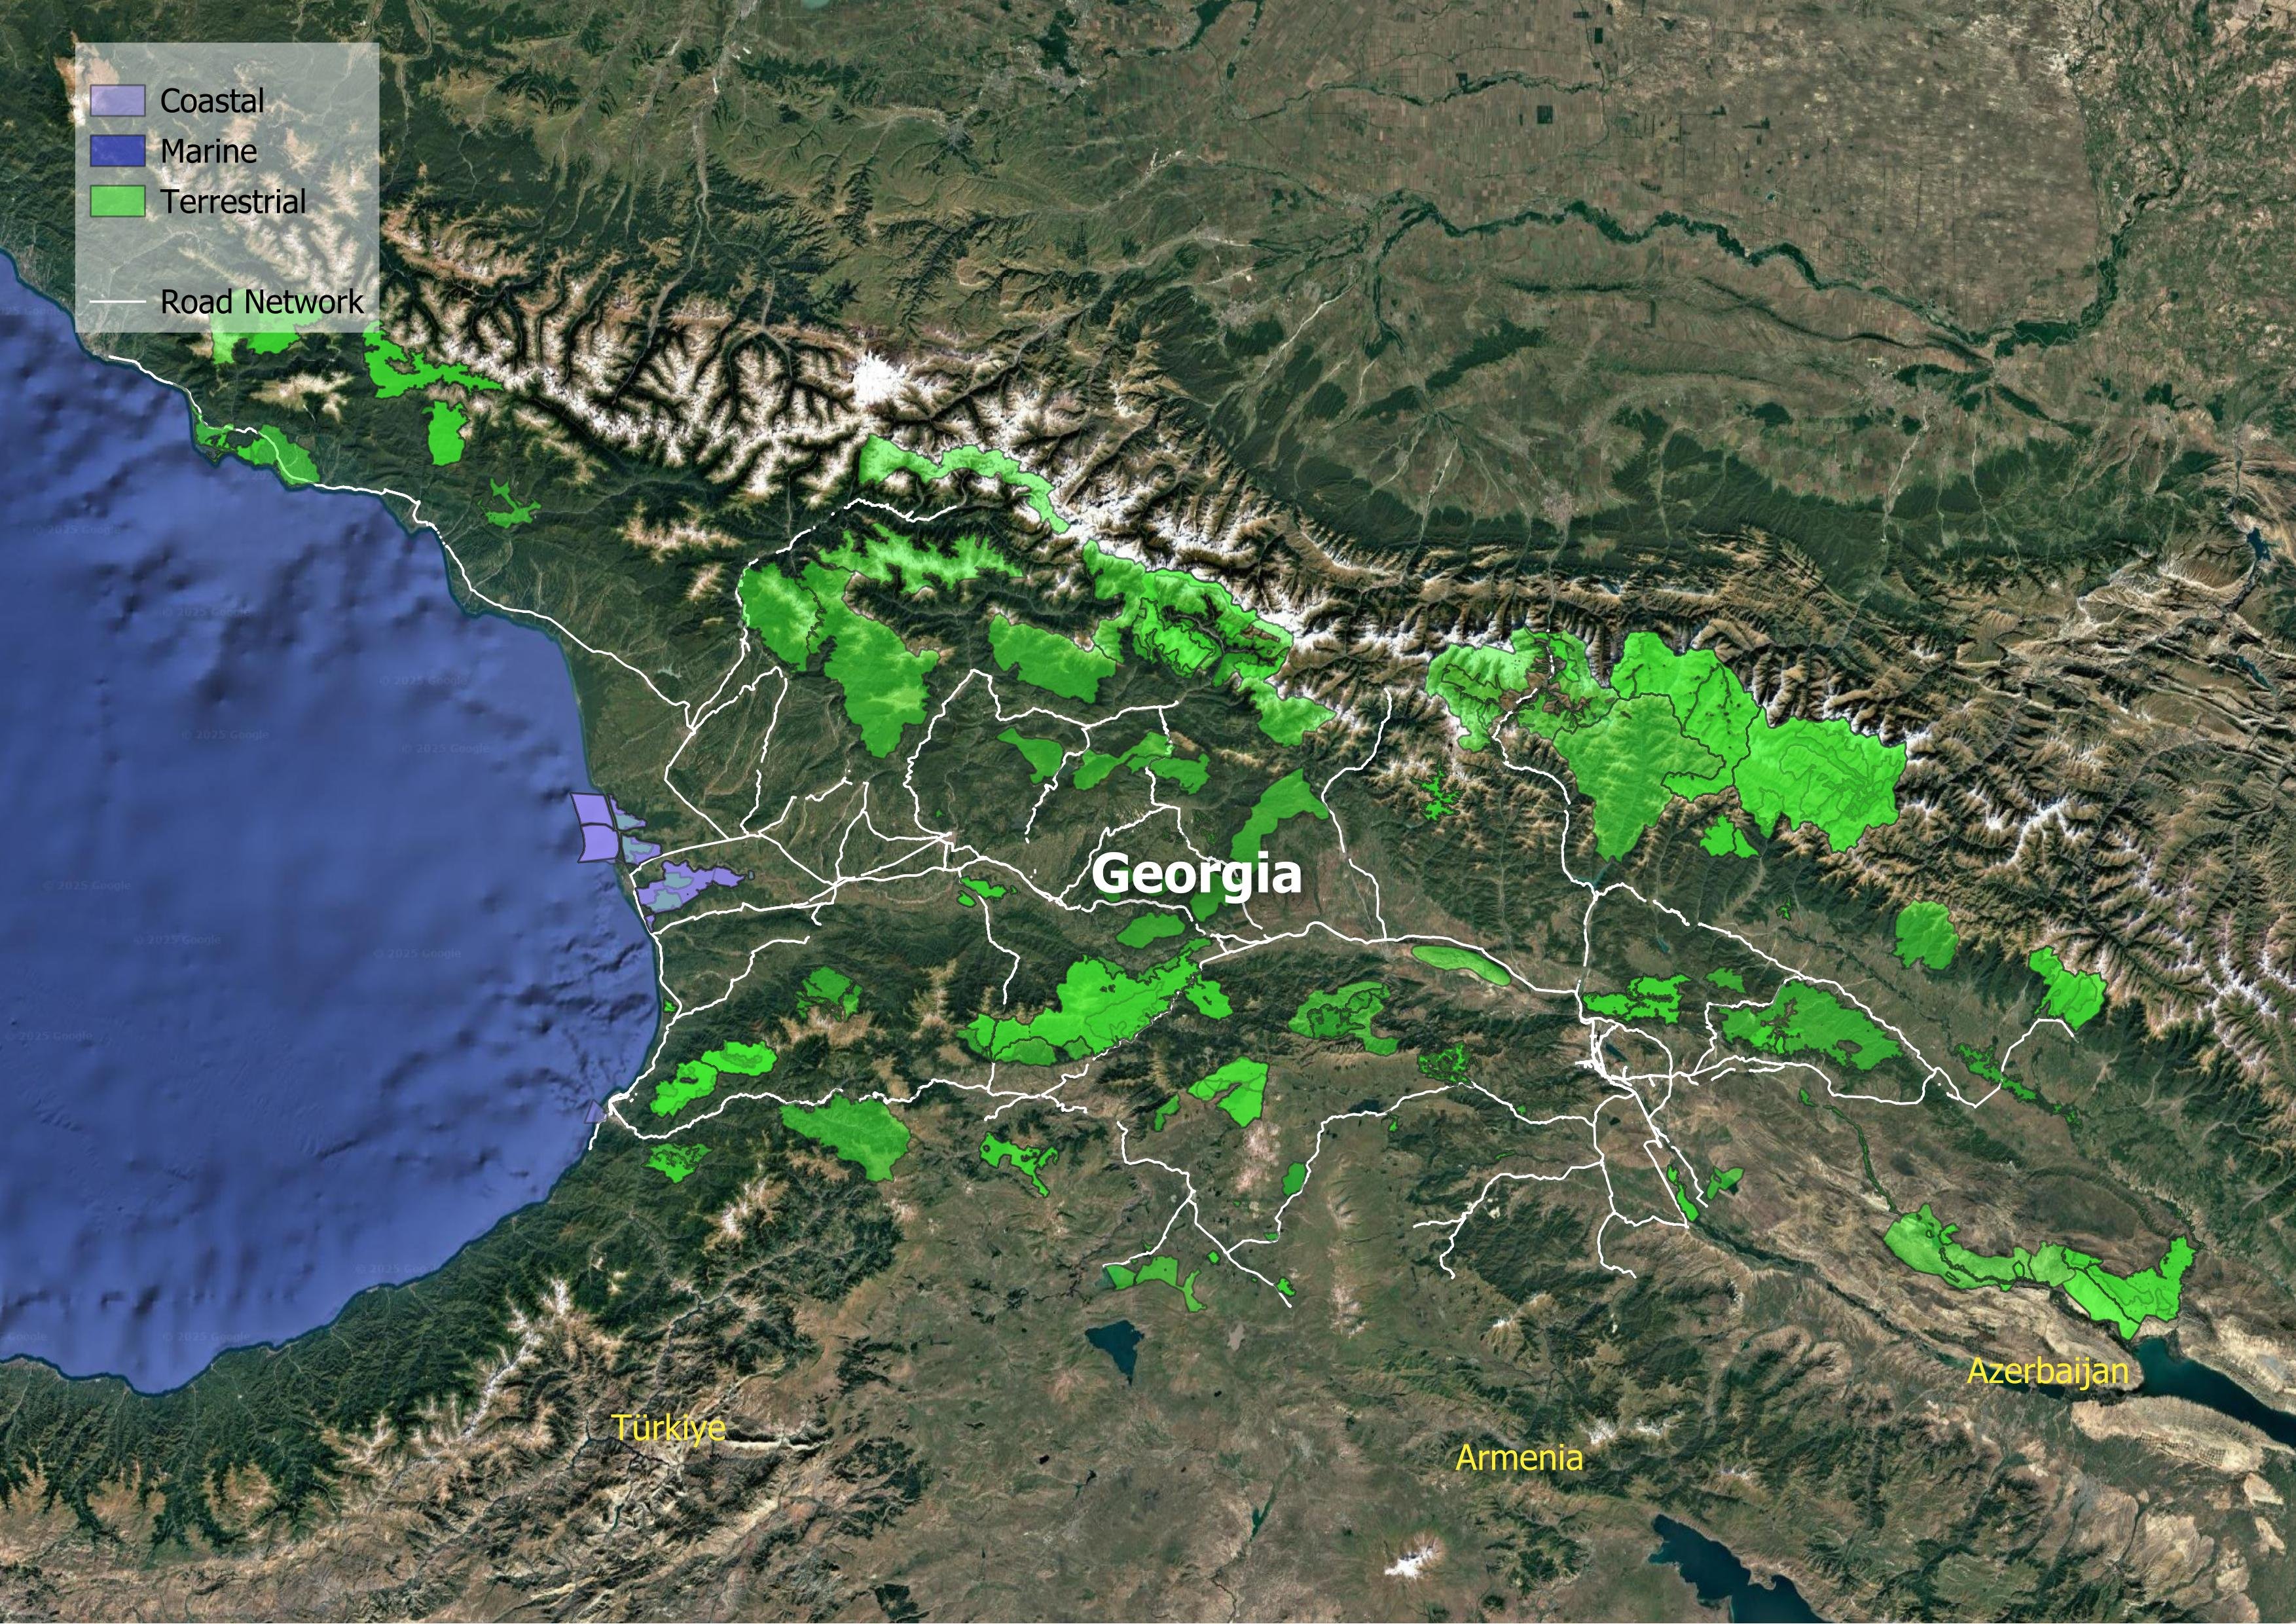
In a nation where 41% of the land is forested, the friction between infrastructure and biodiversity is acute. Of Georgia's 48 key biodiversity areas (KBAs), 44 have been breached by road infrastructure. This has resulted in a road density within sensitive ecosystems of 243 meters per square kilometer—a fragmentation rate nearly three times the Asia-Pacific average of 88 and almost five times that of Central and West Asia.
The air in Georgia carries a heavy hidden cost. The World Bank estimates the annual health damages from ambient and household PM2.5 exposure at $7.1 billion, or 12% of GDP. The road sector is the primary culprit, generating 99% of the transport sector's harmful particulate emissions. While tailpipe emissions are slowly stabilizing, the sheer volume of fossil fuel subsidies—which incur external societal costs in congestion and crashes—keeps the system dirty.
Safety remains elusive. The World Health Organization estimates 476 annual road crash fatalities. The economic consequences of road traffic crashes in Georgia are substantial. In 2021, these fatalities and serious injuries cost an estimated 741 million USD, representing roughly 4% of Georgia's GDP. This safety crisis is compounded by an access crisis. In 40% of Georgia's urban agglomerations, only two out of ten residents have convenient access to public transport, forcing a reliance on private vehicles that perpetuates the cycle of risk and emission.
Georgia stands at a critical juncture in its transport development. It possesses a "clean grid advantage", yet its road transport sector remains carbon-intensive and heavily motorized. The country faces a dual challenge: it must accelerate the electrification of its fleet and decarbonise while simultaneously hardening its infrastructure against the inevitable shocks of a changing climate.
Decarbonization
Climate Resilience
Water and Land Management
Reducing Pollution
Preserving Biodiversity
Sustainable Materials Sourcing and Construction Practices
Improving Quality of life
Disaster Preparedness
Fostering Inclusive Growth
Supporting Information
Road Infrastructure Pipeline
| Batumi Bypass Road Project | 2017 | 315.2 million USD | 216.2 |
| Batumi-Sarpi Road Project | 2025 | None | 11 |
| East-West Highway (Khevi-Ubisa Section) Improvement Project | 2018 | 429.53 million USD | None |
| East-West Highway Improvement Project (II) | 2016 | None | None |
| East-West Highway Improvement Project (Phase2) | 2018 | None | None |
| East–West Highway (Shorapani–Argveta Section) Improvement Project | 2019 | 367.4 million USD | None |
| Georgia: Batumi Bypass Road | 2017 | None | 14.3 |
| North–South Corridor (Kvesheti–Kobi) Road Project | 2019 | 498.6 million USD | 28 |
Unit Cost Road Projects
Road Transport Policy Landscape
Road Transport Policy Targets
No data
Road Transport Policy Measure Types
References
AIIB. (n.d.). MEASURING TRANSPORT CONNECTIVITY FOR TRADE IN ASIA. https://impact.economist.com/perspectives/sites/default/files/eco141_aiib_transport_connectivity_4.pdf/
Asian Transport Observatory. (2025). Asia and the Pacific's Transport Infrastructure and Investment Outlook 2035. https://asiantransportobservatory.org/analytical-outputs/asia-transport-infrastructure-investment-needs/
Barrington-Leigh, C., & Millard-Ball, A. (2025). A high-resolution global time series of street-network sprawl. https://journals.sagepub.com/doi/10.1177/23998083241306829
CDRI. (2023). Global Infrastructure Risk Model and Resilience Index. https://giri.unepgrid.ch/
CIESIN. (2023a). Rural Access Index [Dataset]. https://sedac.ciesin.columbia.edu/data/set/sdgi-9-1-1-rai-2023
CIESIN. (2023b). SDG Indicator 11.2.1: Urban Access to Public Transport, 2023 Release: Sustainable Development Goal Indicators (SDGI). https://sedac.ciesin.columbia.edu/data/set/sdgi-11-2-1-urban-access-public-transport-2023
EDGAR. (2025). GHG emissions of all world countries: 2025. Publications Office. https://data.europa.eu/doi/10.2760/9816914
Ember. (2024). Electricity Data Explorer [Dataset]. https://ember-energy.org/data/electricity-data-explorer
EM-DAT. (2025). EM-DAT - The international disaster database. https://www.emdat.be/European Commission. (2024). Global Air Pollutant Emissions EDGAR v8.1 [Dataset]. https://edgar.jrc.ec.europa.eu/dataset_ap61#sources
IEA. (n.d.). Fossil Fuel Subsidies. IEA. Retrieved April 19, 2025, from https://www.iea.org/topics/fossil-fuel-subsidies
ILO. (2025). ILOSTAT [Dataset]. https://rplumber.ilo.org/files/website/bulk/indicator.html
ITDP. (2024). The Atlas of Sustainable City Transport. https://atlas.itdp.org/
Koks, E., Rozenberg, J., Tariverdi, M., Dickens, B., Fox, C., Ginkel, K. van, & Hallegatte, S. (2023). A global assessment of national road network vulnerability. Environmental Research: Infrastructure and Sustainability, 3(2), 025008. https://doi.org/10.1088/2634-4505/acd1aa
Liu, K., Wang, Q., Wang, M., & Koks, E. E. (2023). Global transportation infrastructure exposure to the change of precipitation in a warmer world. Nature Communications, 14(1), 2541. https://doi.org/10.1038/s41467-023-38203-3
McDuffie, E. E., Martin, R. V., Spadaro, J. V., Burnett, R., Smith, S. J., O'Rourke, P., Hammer, M. S., van Donkelaar, A., Bindle, L., Shah, V., Jaeglé, L., Luo, G., Yu, F., Adeniran, J. A., Lin, J., & Brauer, M. (2021). Source sector and fuel contributions to ambient PM2.5 and attributable mortality across multiple spatial scales. Nature Communications, 12(1), 3594. https://doi.org/10.1038/s41467-021-23853-y
Parry, S. B., Antung A. Liu,Ian W. H. (2023). IMF Fossil Fuel Subsidies Data: 2023 Update. IMF. https://www.imf.org/en/publications/wp/issues/2023/08/22/imf-fossil-fuel-subsidies-data-2023-update-537281
Simkins, A. T., Beresford, A. E., Buchanan, G. M., Crowe, O., Elliott, W., Izquierdo, P., Patterson, D. J., & Butchart, S. H. M. (2023). A global assessment of the prevalence of current and potential future infrastructure in Key Biodiversity Areas. Biological Conservation, 281, 109953. https://doi.org/10.1016/j.biocon.2023.109953
Sims, M., Stanimirova, R., Neumann, M., Raichuk, A., & Purves, D. (2025). New Data Shows What's Driving Forest Loss Around the World. https://www.wri.org/insights/forest-loss-drivers-data-trends
Trademap. (2025). Trade Map. Trade Map. https://www.trademap.org/Index.aspx
UN DESA. (n.d.). Economic and Environmental Vulnerability Indicators. Retrieved January 26, 2026, from https://policy.desa.un.org/themes/least-developed-countries-category/ldc-identification-criteria-indicators/evi-indicators
UN DESA. (2025). 2024 Revision of World Population Prospects. https://population.un.org/wpp/
UN Energy Statistics. (2025). Energy Balance Visualization [Dataset]. https://unstats.un.org/unsd/energystats/dataPortal/
UNEP. (2021, May 12). Domestic material consumption (DMC) and DMC per capita, per GDP (Tier I). https://www.unep.org/indicator-1222
Weiss, D. J., Nelson, A., Gibson, H. S., Temperley, W., Peedell, S., Lieber, A., Hancher, M., Poyart, E., Belchior, S., Fullman, N., Mappin, B., Dalrymple, U., Rozier, J., Lucas, T. C. D., Howes, R. E., Tusting, L. S., Kang, S. Y., Cameron, E., Bisanzio, D., … Gething, P. W. (2018). A global map of travel time to cities to assess inequalities in accessibility in 2015. Nature, 553(7688), 333-336. https://doi.org/10.1038/nature25181
WHO. (2023). Global Status Report on Road Safety 2023. https://www.who.int/teams/social-determinants-of-health/safety-and-mobility/global-status-report-on-road-safety-2023
Wiedenhofer, D., Baumgart, A., Matej, S., Virág, D., Kalt, G., Lanau, M., Tingley, D. D., Liu, Z., Guo, J., Tanikawa, H., & Haberl, H. (2024). Mapping and modelling global mobility infrastructure stocks, material flows and their embodied greenhouse gas emissions [Dataset]. https://doi.org/10.1016/j.jclepro.2023.139742
World Bank. (2021). ICP 2021. https://databank.worldbank.org/source/icp-2021
World Bank. (2022a). Annual freshwater withdrawals, total (% of internal resources) [Dataset]. https://data.worldbank.org
World Bank. (2022b). Land area (sq. Km) [Dataset]. https://data.worldbank.org
World Bank. (2022c). The Global Health Cost of PM2.5 Air Pollution: A Case for Action Beyond 2021. The World Bank. https://doi.org/10.1596/978-1-4648-1816-5
World Bank. (2023). Forest area (% of land area) [Dataset]. https://data.worldbank.org/indicator/AG.LND.FRST.ZS
World Bank. (2024). Home | Logistics Performance Index (LPI). Logistics Performance Index. https://lpi.worldbank.org/
World Bank. (2025a). GDP per capita, PPP (current international $) [Dataset]. https://data.worldbank.org/indicator/NY.GDP.PCAP.PP.CD
World Bank. (2025b). GDP, PPP (current international $) [Dataset]. https://data.worldbank.org/indicator/NY.GDP.MKTP.PP.CD
World Database on Protected Areas. (2024). Protected Areas (WDPA) [Dataset]. https://www.protectedplanet.net/en/thematic-areas/wdpa?tab=WDPA