
Fiji Green Roads Profile 2025
FIJI
GREEN ROADS PROFILESupported by:
The ATO green roads profiles present country-level perspectives on how 35 Asia-Pacific economies are addressing the development and management of sustainable eco-friendly roads. Drawing from diverse datasets and policy documents, the profiles highlight practices and measures that contribute to greener transport infrastructure.
Developed by the Asian Transport Observatory (ATO) in partnership with the International Road Federation (IRF), the profiles are designed to complement the Green Roads Toolkit. The toolkit provides a practical reference for integrating good practices across nine dimensions:
- Decarbonization
- Climate resilience
- Water and land management
- Pollution reduction
- Conserving biodiversity
- Responsible sourcing of materials
- Improving quality of life
- Disaster preparedness
- Fostering inclusive growth
This 2025 edition builds on earlier work to provide a comprehensive resource for guiding the planning, development, construction, and management of greener, more sustainable roads.
Background
Indicator - Dimension Matrix

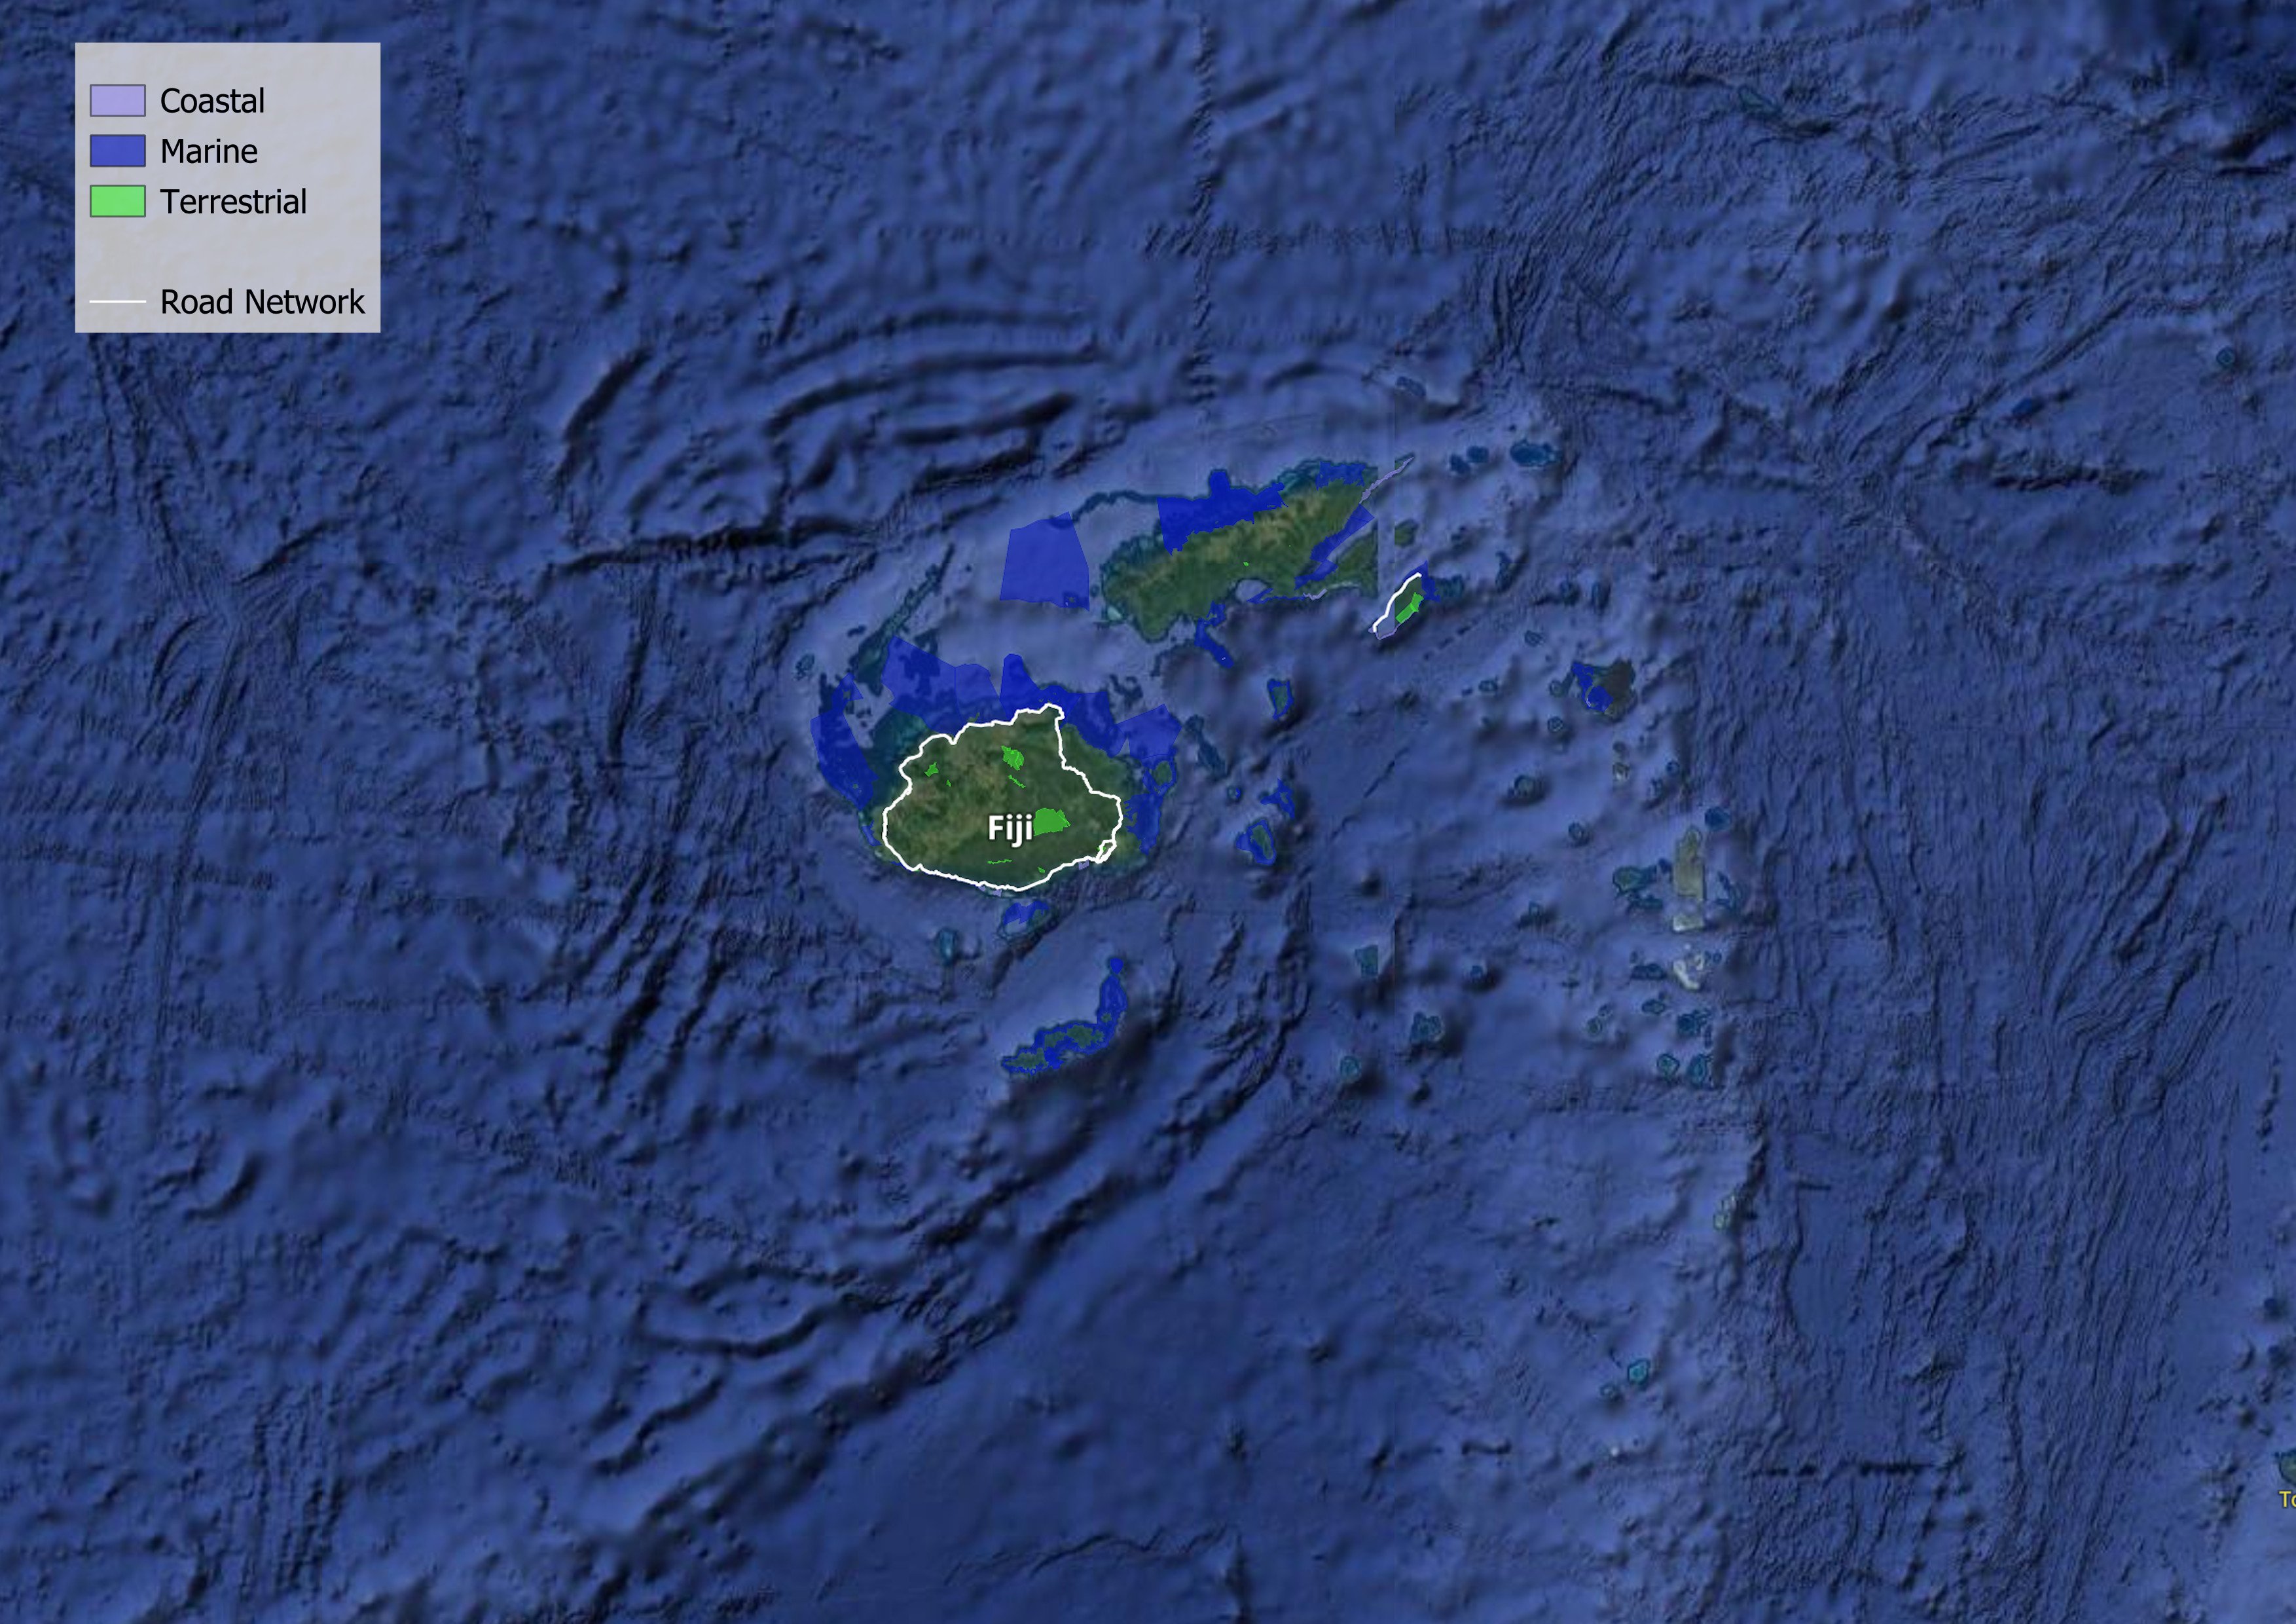
The archipelago covers 18,000 square kilometers. To connect this fragmented land, Fiji built a 12,100-kilometer road network in 2024, mainly consisting of local and rural roads—94% of the total—forming a capillary system without motorways. With a density of 662 meters per square kilometer, it reflects a strong effort to establish connectivity. Since 2000, road access increased from 7.1 to 13.0 kilometers per thousand people, yet nearly 89,000 rural residents—about 10%—remain isolated without all-season roads, missing out on markets, healthcare, and development opportunities. The vehicle fleet is evolving: motorization now stands at 167 vehicles per thousand people, lower than the Asia-Pacific average of 317, but rising rapidly. Most vehicles (77%) are light-duty, with 18% trucks, while public transport via buses accounts for only 2%, leading to higher emissions from private vehicles.
Fiji's road transport sector is decoupling from the broader economy, but in the wrong direction. While economy-wide emissions have reduced, shrinking by 0.1% annually, road transport emissions have climbed by 2.2% per year since 2000. By 2024, the sector emitted 609,000 tonnes of CO2e into the atmosphere. The intensity of this pollution is stark. For every dollar of GDP generated, Fiji's roads emit 41 grams of CO2e. This is an improvement from 1990 levels, yet it lags behind the regional efficiency; the Asia-Pacific average sits at 26 grams. The sector now accounts for 86% of total transport emissions and over a fifth of the nation's entire carbon output.
There is a flicker of transition. The value of electric vehicle (EV) imports reached $6 million between 2015 and 2024. EVs now represent 2% of total road vehicle imports, primarily light-duty vehicles. But the shift is nascent. The UNEP E-mobility Readiness Index scores Fiji at 62 out of 100, signaling that while the policy framework (score 15) and energy landscape (score 22) are taking shape, the market maturity (score 10) lags.
The physical vulnerability of this network is acute. In a future warming scenario of 4.5 degrees, more than 80% of Fiji's road assets face exposure to frequent and extreme precipitation. The financial penalty is already visible. The country faces average annual losses of $4.7 million to transport infrastructure, half of which is road-related. Bridges, though a fraction of the physical stock, bear a disproportionate 11.3% of these losses. This infrastructure fragility compounds the economic burden on households, where transport already consumes 7.4% of total expenditure.
Pollution exacts a quieter, deadlier toll. The concentration of PM 2.5 hit 9.7 micrograms per cubic meter in 2019. The World Bank estimates the cost of health damages from this exposure at $935 million annually—equivalent to roughly 7% of Fiji's GDP. While the road sector contributes 20% of transport-related PM 2.5, the reduction in tailpipe emissions—down 4.6% per year since 2015—suggests that policy interventions are beginning to work.
Yet, the interaction between infrastructure and nature is precarious. Fiji retains 63% forest cover. However, roads are encroaching on ecological sanctuaries. In the country's 42 Key Biodiversity Areas (KBAs), road density stands at 46 meters per thousand square kilometers. While this is less intrusive than the Asia-Pacific average of 88 meters, it represents a permanent pressure on endemic life.
Safety remains an unresolved crisis. Fossil fuel subsidies, intended to support mobility, incur distinct external costs: 44% of these hidden costs manifest as road crashes. Despite the seemingly low fatality rate, the economic burden of road crashes in Fiji is substantial. Estimated at approximately 73 million USD for 2021, this represents roughly 2% of Fiji's GDP. This figure accounts for fatalities and serious injuries, highlighting the significant economic impact of road crashes. Achieving the global target of halving fatalities by 2030 requires a reduction rate of 7.4% per year. The current trajectory saves lives, but not enough of them.
Fiji presents a paradox of connectivity and vulnerability. The nation has successfully expanded road availability to outpace population growth, yet a significant rural minority remains isolated. The transport sector's carbon footprint is growing, diverging from the rest of the decarbonizing economy and lagging behind regional efficiency benchmarks. While the initial uptake of electric mobility and reductions in particulate matter offer positive signals, the road network faces existential threats from climate volatility and exacts a high socio-economic price through health damages and safety risks.
Decarbonization
Climate Resilience
Water and Land Management
Reducing Pollution
Preserving Biodiversity
Sustainable Materials Sourcing and Construction Practices
Improving Quality of life
Disaster Preparedness
Fostering Inclusive Growth
Supporting Information
Road Infrastructure Pipeline
| Critical Bridges Resilience Project | 2024 | 136.5 million USD | None |
| Fiji Critical Bridges Resilience Project | 2025 | 110 million USD | None |
Unit Cost Road Projects
Road Transport Policy Landscape
Road Transport Policy Targets
No data
Road Transport Policy Measure Types
References
AIIB. (n.d.). MEASURING TRANSPORT CONNECTIVITY FOR TRADE IN ASIA. https://impact.economist.com/perspectives/sites/default/files/eco141_aiib_transport_connectivity_4.pdf/
Asian Transport Observatory. (2025). Asia and the Pacific's Transport Infrastructure and Investment Outlook 2035. https://asiantransportobservatory.org/analytical-outputs/asia-transport-infrastructure-investment-needs/
Barrington-Leigh, C., & Millard-Ball, A. (2025). A high-resolution global time series of street-network sprawl. https://journals.sagepub.com/doi/10.1177/23998083241306829
CDRI. (2023). Global Infrastructure Risk Model and Resilience Index. https://giri.unepgrid.ch/
CIESIN. (2023a). Rural Access Index [Dataset]. https://sedac.ciesin.columbia.edu/data/set/sdgi-9-1-1-rai-2023
CIESIN. (2023b). SDG Indicator 11.2.1: Urban Access to Public Transport, 2023 Release: Sustainable Development Goal Indicators (SDGI). https://sedac.ciesin.columbia.edu/data/set/sdgi-11-2-1-urban-access-public-transport-2023
EDGAR. (2025). GHG emissions of all world countries: 2025. Publications Office. https://data.europa.eu/doi/10.2760/9816914
Ember. (2024). Electricity Data Explorer [Dataset]. https://ember-energy.org/data/electricity-data-explorer
EM-DAT. (2025). EM-DAT - The international disaster database. https://www.emdat.be/European Commission. (2024). Global Air Pollutant Emissions EDGAR v8.1 [Dataset]. https://edgar.jrc.ec.europa.eu/dataset_ap61#sources
IEA. (n.d.). Fossil Fuel Subsidies. IEA. Retrieved April 19, 2025, from https://www.iea.org/topics/fossil-fuel-subsidies
ILO. (2025). ILOSTAT [Dataset]. https://rplumber.ilo.org/files/website/bulk/indicator.html
ITDP. (2024). The Atlas of Sustainable City Transport. https://atlas.itdp.org/
Koks, E., Rozenberg, J., Tariverdi, M., Dickens, B., Fox, C., Ginkel, K. van, & Hallegatte, S. (2023). A global assessment of national road network vulnerability. Environmental Research: Infrastructure and Sustainability, 3(2), 025008. https://doi.org/10.1088/2634-4505/acd1aa
Liu, K., Wang, Q., Wang, M., & Koks, E. E. (2023). Global transportation infrastructure exposure to the change of precipitation in a warmer world. Nature Communications, 14(1), 2541. https://doi.org/10.1038/s41467-023-38203-3
McDuffie, E. E., Martin, R. V., Spadaro, J. V., Burnett, R., Smith, S. J., O'Rourke, P., Hammer, M. S., van Donkelaar, A., Bindle, L., Shah, V., Jaeglé, L., Luo, G., Yu, F., Adeniran, J. A., Lin, J., & Brauer, M. (2021). Source sector and fuel contributions to ambient PM2.5 and attributable mortality across multiple spatial scales. Nature Communications, 12(1), 3594. https://doi.org/10.1038/s41467-021-23853-y
Parry, S. B., Antung A. Liu,Ian W. H. (2023). IMF Fossil Fuel Subsidies Data: 2023 Update. IMF. https://www.imf.org/en/publications/wp/issues/2023/08/22/imf-fossil-fuel-subsidies-data-2023-update-537281
Simkins, A. T., Beresford, A. E., Buchanan, G. M., Crowe, O., Elliott, W., Izquierdo, P., Patterson, D. J., & Butchart, S. H. M. (2023). A global assessment of the prevalence of current and potential future infrastructure in Key Biodiversity Areas. Biological Conservation, 281, 109953. https://doi.org/10.1016/j.biocon.2023.109953
Sims, M., Stanimirova, R., Neumann, M., Raichuk, A., & Purves, D. (2025). New Data Shows What's Driving Forest Loss Around the World. https://www.wri.org/insights/forest-loss-drivers-data-trends
Trademap. (2025). Trade Map. Trade Map. https://www.trademap.org/Index.aspx
UN DESA. (n.d.). Economic and Environmental Vulnerability Indicators. Retrieved January 26, 2026, from https://policy.desa.un.org/themes/least-developed-countries-category/ldc-identification-criteria-indicators/evi-indicators
UN DESA. (2025). 2024 Revision of World Population Prospects. https://population.un.org/wpp/
UN Energy Statistics. (2025). Energy Balance Visualization [Dataset]. https://unstats.un.org/unsd/energystats/dataPortal/
UNEP. (2021, May 12). Domestic material consumption (DMC) and DMC per capita, per GDP (Tier I). https://www.unep.org/indicator-1222
Weiss, D. J., Nelson, A., Gibson, H. S., Temperley, W., Peedell, S., Lieber, A., Hancher, M., Poyart, E., Belchior, S., Fullman, N., Mappin, B., Dalrymple, U., Rozier, J., Lucas, T. C. D., Howes, R. E., Tusting, L. S., Kang, S. Y., Cameron, E., Bisanzio, D., … Gething, P. W. (2018). A global map of travel time to cities to assess inequalities in accessibility in 2015. Nature, 553(7688), 333-336. https://doi.org/10.1038/nature25181
WHO. (2023). Global Status Report on Road Safety 2023. https://www.who.int/teams/social-determinants-of-health/safety-and-mobility/global-status-report-on-road-safety-2023
Wiedenhofer, D., Baumgart, A., Matej, S., Virág, D., Kalt, G., Lanau, M., Tingley, D. D., Liu, Z., Guo, J., Tanikawa, H., & Haberl, H. (2024). Mapping and modelling global mobility infrastructure stocks, material flows and their embodied greenhouse gas emissions [Dataset]. https://doi.org/10.1016/j.jclepro.2023.139742
World Bank. (2021). ICP 2021. https://databank.worldbank.org/source/icp-2021
World Bank. (2022a). Annual freshwater withdrawals, total (% of internal resources) [Dataset]. https://data.worldbank.org
World Bank. (2022b). Land area (sq. Km) [Dataset]. https://data.worldbank.org
World Bank. (2022c). The Global Health Cost of PM2.5 Air Pollution: A Case for Action Beyond 2021. The World Bank. https://doi.org/10.1596/978-1-4648-1816-5
World Bank. (2023). Forest area (% of land area) [Dataset]. https://data.worldbank.org/indicator/AG.LND.FRST.ZS
World Bank. (2024). Home | Logistics Performance Index (LPI). Logistics Performance Index. https://lpi.worldbank.org/
World Bank. (2025a). GDP per capita, PPP (current international $) [Dataset]. https://data.worldbank.org/indicator/NY.GDP.PCAP.PP.CD
World Bank. (2025b). GDP, PPP (current international $) [Dataset]. https://data.worldbank.org/indicator/NY.GDP.MKTP.PP.CD
World Database on Protected Areas. (2024). Protected Areas (WDPA) [Dataset]. https://www.protectedplanet.net/en/thematic-areas/wdpa?tab=WDPA