
Cambodia Green Roads Profile 2025
CAMBODIA
GREEN ROADS PROFILESupported by:
The ATO green roads profiles present country-level perspectives on how 35 Asia-Pacific economies are addressing the development and management of sustainable eco-friendly roads. Drawing from diverse datasets and policy documents, the profiles highlight practices and measures that contribute to greener transport infrastructure.
Developed by the Asian Transport Observatory (ATO) in partnership with the International Road Federation (IRF), the profiles are designed to complement the Green Roads Toolkit. The toolkit provides a practical reference for integrating good practices across nine dimensions:
- Decarbonization
- Climate resilience
- Water and land management
- Pollution reduction
- Conserving biodiversity
- Responsible sourcing of materials
- Improving quality of life
- Disaster preparedness
- Fostering inclusive growth
This 2025 edition builds on earlier work to provide a comprehensive resource for guiding the planning, development, construction, and management of greener, more sustainable roads.
Background
Indicator - Dimension Matrix

Cambodia's mobility landscape is characterized by significant inequality. The country has 78.4 thousand kilometers of roads, mostly consisting of local and rural types—92%—with only 2% being motorways and main highways. Infrastructure density is low at 444 meters per square kilometer. Despite gradual improvements—an increase from 3.5 km per thousand people in 2000 to 4.4 in 2024—the physical infrastructure is still inadequate for the country's economic goals.
Motorization rates tell a misleading story. With just 55 vehicles per thousand people in 2024, Cambodia seems to be in early stages of mobility compared to the Asia-Pacific average of 317. However, its environmental impact is substantial, with road transport greenhouse gases reaching 5.9 million tonnes of CO2e in 2024. Emissions are not only rising but doing so at 7.1% annually, nearly double the economic growth rate of 3.8%. The road transport sector accounts for 81% of total transport emissions. The primary driver of pollution isn't private cars but heavy vehicles. Heavy-duty vehicles (HDVs) produce 64% of transport-related CO2 emissions, even though the fleet mainly consists of two-wheelers (41%) and light-duty vehicles (47%). This indicates structural inefficiency. Carbon intensity per GDP has increased from 15 grams of CO2e per USD in 1990 to 42 grams in 2024, higher than the regional average of 26 grams. Since 2015, progress has been slow, with a slight annual decrease of 2.0%, compared to a sharper regional reduction of 5.4%.
Electrification presents a brighter outlook. Between 2015 and 2024, EV imports reached 172 million USD, representing 9% of total vehicle imports by 2024 (by value). However, the energy powering these vehicles remains not entirely green; the grid's emission factor is 498 gCO2 per kWh, slightly cleaner than the regional average of 559. Yet, Cambodia's grid intensity has increased slightly since 2015, contrasting with regional improvements.
Air quality issues are significant. PM 2.5 levels averaged 21.3 micrograms per cubic meter, causing at least 215 early deaths. The economic toll is substantial; the World Bank estimates health damages from PM 2.5 exposure at around 6.3 billion USD annually—about 8% of GDP—with road transport responsible for 15% of this pollution. Climate vulnerability worsens the risk. Under a 4.5°C warming scenario, over half (52%) of Cambodia's road and rail assets could face damage from extreme rainfall. Infrastructure losses average 4.5 million USD annually, mainly affecting roads (91%) and, to a lesser extent, bridges and tunnels (2.2%), despite their small physical share.
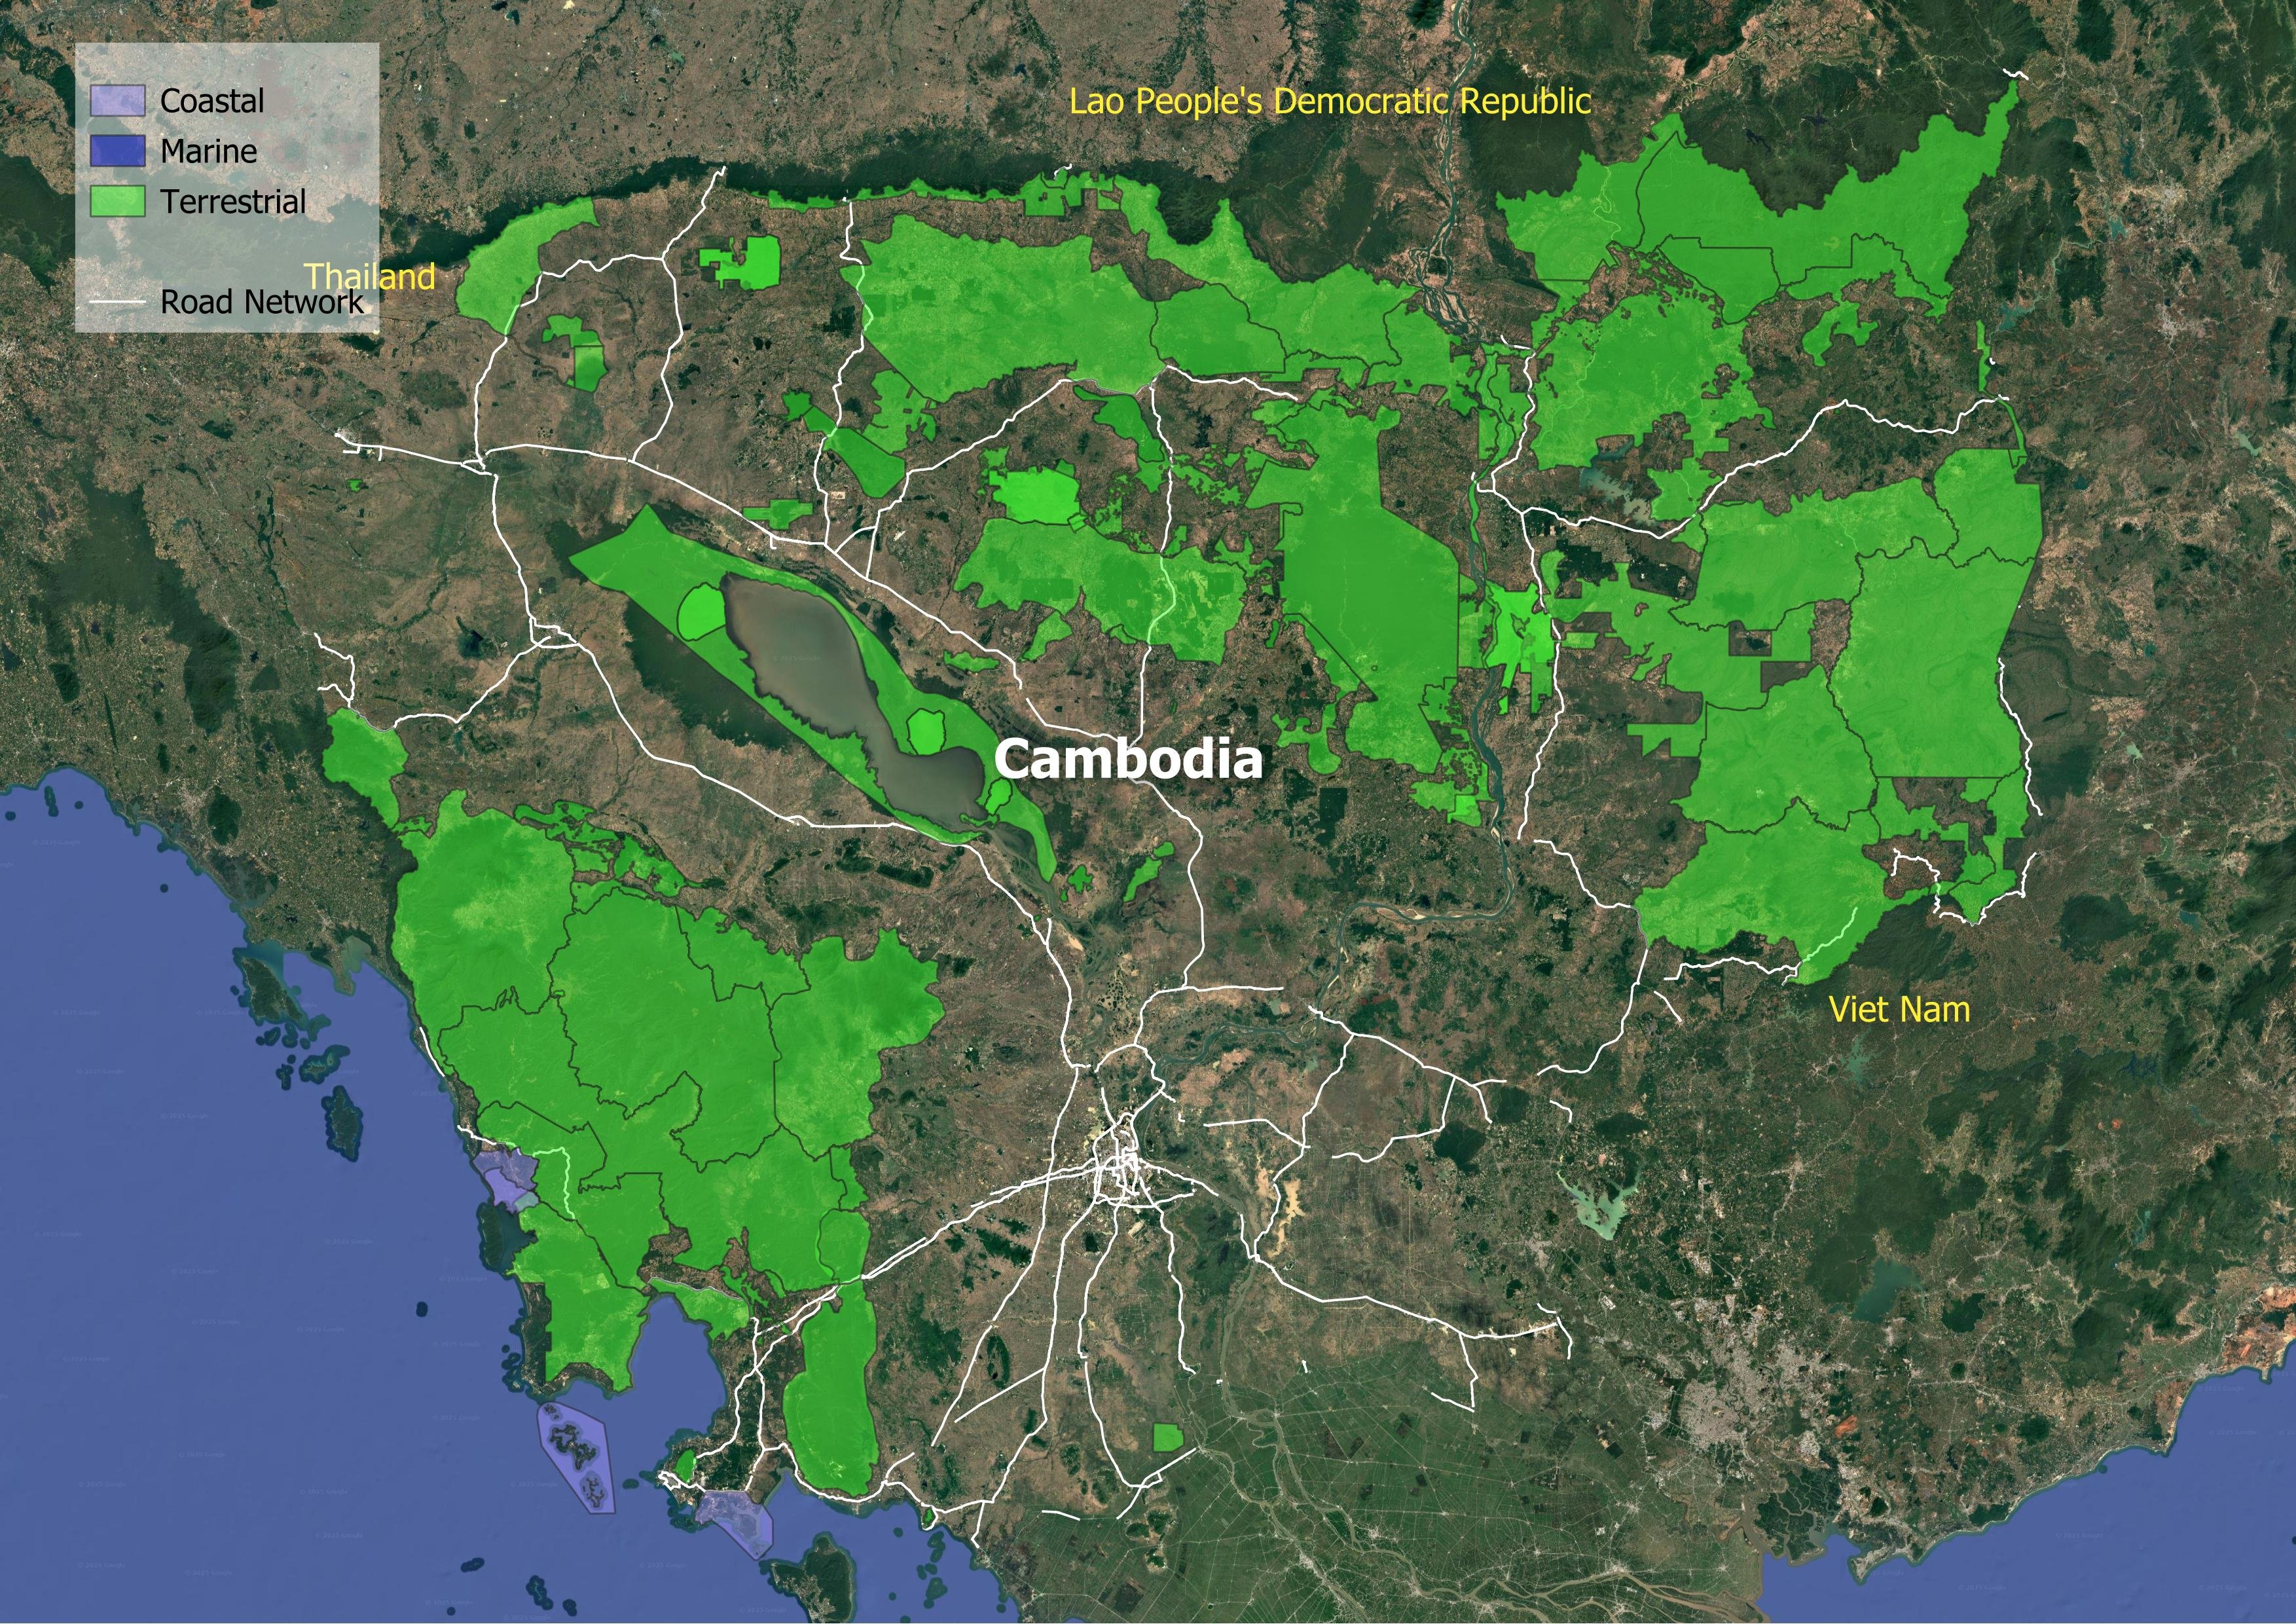
The road network impacts nature and social equity. Cambodia's forests, covering 43% of land, are increasingly encroached upon—35 of 45 Key Biodiversity Areas are now intersected by roads. This results in 45 meters of road per thousand square kilometers of protected land, lower than Southeast Asia's average but still causing fragmentation.
On the social side, millions remain disconnected. About 2.9 million rural residents live more than two kilometers from all-season roads. Urban accessibility is also unequal, with only 20% having easy access to public transport. In Cambodia, road crash fatalities decreased by approximately -5.9% per year between 2016 and 2021. However, this is not enough to reach the 2030 target to halve the fatalities by 2030; 3,113 lives were lost in 2021.
The transport workforce employs about 434,000 people, yet women only make up 7.4%, highlighting gender disparities. Overall, Cambodia faces a complex challenge. The country exhibits low vehicle ownership but high emissions from a legacy fleet, a fragile network vulnerable to climate shocks, and social benefits that lag behind infrastructure investments. Without urgent action—particularly in decarbonizing freight, strengthening infrastructure, and improving rural access—the road sector risks becoming a burden rather than a driver of development.
Decarbonization
Climate Resilience
Water and Land Management
Reducing Pollution
Preserving Biodiversity
Sustainable Materials Sourcing and Construction Practices
Improving Quality of life
Disaster Preparedness
Fostering Inclusive Growth
Supporting Information
Road Infrastructure Pipeline
| Additional Financing to Road Connectivity Improvement Project | 2024 | 20 million USD | None |
| Cambodia Road Connectivity Improvement | 2020 | 100 million USD | None |
| KH - Road Asset Management Project II | 2016 | 64.8 million USD | None |
| National Road No. 5 Improvement Project (Prek Kdam- Thlea Maam Section) (II) | 2016 | None | None |
| National Road No. 5 Improvement Project (Thlea Ma'am - Battambang and Sri Sophorn - Poipet Sections) (III) | 2024 | None | None |
| National Road No. 5 Improvement Project (Thlea Maam-Battambang and Sri Sophorn-Poipet Sections) (I) | 2015 | None | None |
| National Road No.5 Improvement Project (Battambang-Sri Sophorn Section)(II) | 2017 | None | None |
| National Road No.5 Improvement Project (Prek Kdam - Thlea Maam Section) (III) | 2020 | None | None |
| National Road No.5 Improvement Project (Thlea Maam - Battambang and Sri Sophorn - Poipet Sections) (II) | 2020 | None | None |
| Provincial Roads Improvement Project–Additional Financing | 2016 | 6 million USD | 157 |
| Road Asset Management Project II Additional Financing | 2018 | 113 million USD | None |
| Road Network Improvement Project (Phase 2) | 2021 | 90 million USD | None |
| Rural Road Connectivity Improvement Project | 2023 | None | None |
Road User Charging
| Actual maintenance budget | 95 |
| Required maintenance budget | 212 |
| Maintenance budget deficit | 117 |
| Vehicle customs duty | 418 |
| Vehicle special tax | 106 |
| Vehicle value added tax | 224 |
| Fuel customs duty | 72 |
| Fuel additional tax | 54 |
| Fuel special tax | 100 |
| Fuel value added tax | 212 |
| Vehicle registration | 7 |
| Tax on means of transportation | 100 |
| Tolling | 3 |
Unit Cost Road Projects
Road Transport Policy Landscape
Road Transport Policy Targets
| Cambodia's Third Nationally Determined Contribution (NDC 3.0) | 2035 | (2035): 12,000 KM (paved road) (Baseline 2020 - Length of roads in Double Bituminous Surface Retreatment pavement (DBST) 6,723 km, 1,804 km in concrete) |
Road Transport Policy Measure Types
References
AIIB. (n.d.). MEASURING TRANSPORT CONNECTIVITY FOR TRADE IN ASIA. https://impact.economist.com/perspectives/sites/default/files/eco141_aiib_transport_connectivity_4.pdf/
Asian Transport Observatory. (2025). Asia and the Pacific's Transport Infrastructure and Investment Outlook 2035. https://asiantransportobservatory.org/analytical-outputs/asia-transport-infrastructure-investment-needs/
Barrington-Leigh, C., & Millard-Ball, A. (2025). A high-resolution global time series of street-network sprawl. https://journals.sagepub.com/doi/10.1177/23998083241306829
CDRI. (2023). Global Infrastructure Risk Model and Resilience Index. https://giri.unepgrid.ch/
CIESIN. (2023a). Rural Access Index [Dataset]. https://sedac.ciesin.columbia.edu/data/set/sdgi-9-1-1-rai-2023
CIESIN. (2023b). SDG Indicator 11.2.1: Urban Access to Public Transport, 2023 Release: Sustainable Development Goal Indicators (SDGI). https://sedac.ciesin.columbia.edu/data/set/sdgi-11-2-1-urban-access-public-transport-2023
EDGAR. (2025). GHG emissions of all world countries: 2025. Publications Office. https://data.europa.eu/doi/10.2760/9816914
Ember. (2024). Electricity Data Explorer [Dataset]. https://ember-energy.org/data/electricity-data-explorer
EM-DAT. (2025). EM-DAT - The international disaster database. https://www.emdat.be/European Commission. (2024). Global Air Pollutant Emissions EDGAR v8.1 [Dataset]. https://edgar.jrc.ec.europa.eu/dataset_ap61#sources
IEA. (n.d.). Fossil Fuel Subsidies. IEA. Retrieved April 19, 2025, from https://www.iea.org/topics/fossil-fuel-subsidies
ILO. (2025). ILOSTAT [Dataset]. https://rplumber.ilo.org/files/website/bulk/indicator.html
ITDP. (2024). The Atlas of Sustainable City Transport. https://atlas.itdp.org/
Koks, E., Rozenberg, J., Tariverdi, M., Dickens, B., Fox, C., Ginkel, K. van, & Hallegatte, S. (2023). A global assessment of national road network vulnerability. Environmental Research: Infrastructure and Sustainability, 3(2), 025008. https://doi.org/10.1088/2634-4505/acd1aa
Liu, K., Wang, Q., Wang, M., & Koks, E. E. (2023). Global transportation infrastructure exposure to the change of precipitation in a warmer world. Nature Communications, 14(1), 2541. https://doi.org/10.1038/s41467-023-38203-3
McDuffie, E. E., Martin, R. V., Spadaro, J. V., Burnett, R., Smith, S. J., O'Rourke, P., Hammer, M. S., van Donkelaar, A., Bindle, L., Shah, V., Jaeglé, L., Luo, G., Yu, F., Adeniran, J. A., Lin, J., & Brauer, M. (2021). Source sector and fuel contributions to ambient PM2.5 and attributable mortality across multiple spatial scales. Nature Communications, 12(1), 3594. https://doi.org/10.1038/s41467-021-23853-y
Parry, S. B., Antung A. Liu,Ian W. H. (2023). IMF Fossil Fuel Subsidies Data: 2023 Update. IMF. https://www.imf.org/en/publications/wp/issues/2023/08/22/imf-fossil-fuel-subsidies-data-2023-update-537281
Simkins, A. T., Beresford, A. E., Buchanan, G. M., Crowe, O., Elliott, W., Izquierdo, P., Patterson, D. J., & Butchart, S. H. M. (2023). A global assessment of the prevalence of current and potential future infrastructure in Key Biodiversity Areas. Biological Conservation, 281, 109953. https://doi.org/10.1016/j.biocon.2023.109953
Sims, M., Stanimirova, R., Neumann, M., Raichuk, A., & Purves, D. (2025). New Data Shows What's Driving Forest Loss Around the World. https://www.wri.org/insights/forest-loss-drivers-data-trends
Trademap. (2025). Trade Map. Trade Map. https://www.trademap.org/Index.aspx
UN DESA. (n.d.). Economic and Environmental Vulnerability Indicators. Retrieved January 26, 2026, from https://policy.desa.un.org/themes/least-developed-countries-category/ldc-identification-criteria-indicators/evi-indicators
UN DESA. (2025). 2024 Revision of World Population Prospects. https://population.un.org/wpp/
UN Energy Statistics. (2025). Energy Balance Visualization [Dataset]. https://unstats.un.org/unsd/energystats/dataPortal/
UNEP. (2021, May 12). Domestic material consumption (DMC) and DMC per capita, per GDP (Tier I). https://www.unep.org/indicator-1222
Weiss, D. J., Nelson, A., Gibson, H. S., Temperley, W., Peedell, S., Lieber, A., Hancher, M., Poyart, E., Belchior, S., Fullman, N., Mappin, B., Dalrymple, U., Rozier, J., Lucas, T. C. D., Howes, R. E., Tusting, L. S., Kang, S. Y., Cameron, E., Bisanzio, D., … Gething, P. W. (2018). A global map of travel time to cities to assess inequalities in accessibility in 2015. Nature, 553(7688), 333-336. https://doi.org/10.1038/nature25181
WHO. (2023). Global Status Report on Road Safety 2023. https://www.who.int/teams/social-determinants-of-health/safety-and-mobility/global-status-report-on-road-safety-2023
Wiedenhofer, D., Baumgart, A., Matej, S., Virág, D., Kalt, G., Lanau, M., Tingley, D. D., Liu, Z., Guo, J., Tanikawa, H., & Haberl, H. (2024). Mapping and modelling global mobility infrastructure stocks, material flows and their embodied greenhouse gas emissions [Dataset]. https://doi.org/10.1016/j.jclepro.2023.139742
World Bank. (2021). ICP 2021. https://databank.worldbank.org/source/icp-2021
World Bank. (2022a). Annual freshwater withdrawals, total (% of internal resources) [Dataset]. https://data.worldbank.org
World Bank. (2022b). Land area (sq. Km) [Dataset]. https://data.worldbank.org
World Bank. (2022c). The Global Health Cost of PM2.5 Air Pollution: A Case for Action Beyond 2021. The World Bank. https://doi.org/10.1596/978-1-4648-1816-5
World Bank. (2023). Forest area (% of land area) [Dataset]. https://data.worldbank.org/indicator/AG.LND.FRST.ZS
World Bank. (2024). Home | Logistics Performance Index (LPI). Logistics Performance Index. https://lpi.worldbank.org/
World Bank. (2025a). GDP per capita, PPP (current international $) [Dataset]. https://data.worldbank.org/indicator/NY.GDP.PCAP.PP.CD
World Bank. (2025b). GDP, PPP (current international $) [Dataset]. https://data.worldbank.org/indicator/NY.GDP.MKTP.PP.CD
World Database on Protected Areas. (2024). Protected Areas (WDPA) [Dataset]. https://www.protectedplanet.net/en/thematic-areas/wdpa?tab=WDPA