
Brunei Darussalam Green Roads Profile 2025
BRUNEI DARUSSALAM
GREEN ROADS PROFILESupported by:
The ATO green roads profiles present country-level perspectives on how 35 Asia-Pacific economies are addressing the development and management of sustainable eco-friendly roads. Drawing from diverse datasets and policy documents, the profiles highlight practices and measures that contribute to greener transport infrastructure.
Developed by the Asian Transport Observatory (ATO) in partnership with the International Road Federation (IRF), the profiles are designed to complement the Green Roads Toolkit. The toolkit provides a practical reference for integrating good practices across nine dimensions:
- Decarbonization
- Climate resilience
- Water and land management
- Pollution reduction
- Conserving biodiversity
- Responsible sourcing of materials
- Improving quality of life
- Disaster preparedness
- Fostering inclusive growth
This 2025 edition builds on earlier work to provide a comprehensive resource for guiding the planning, development, construction, and management of greener, more sustainable roads.
Background
Indicator - Dimension Matrix

The internal combustion engine drives the pulse of Brunei Darussalam. With a population of 463,000 spread across about 5,000 square kilometers, the country has built a mostly private mobility system. The motorization reached 648 vehicles per thousand residents in 2024, compared to the Asia-Pacific average of 317. This anomaly is structural. The 5,100-kilometer road network favors light-duty vehicles (LDVs), which make up 91% of the fleet. Two-wheelers, common in Southeast Asia, are only 1% here.
This focus on personal mobility has a carbon cost. Road transport emitted 1.3 million tonnes of CO2e in 2024, representing 99% of total transport emissions. The growth is steady—emissions increased by 1.8% annually since 2000, outpacing the economy-wide growth of 1.4%. However, the data shows a divergence: while emissions rise in absolute terms, efficiency improves. Since 2015, emissions per unit of GDP have declined at an average rate of 5.8% annually, better than the regional improvement of 5.4%. Brunei's emissions intensity is 30 grams of CO2e per USD, nearing the regional average of 26. Engines are cleaner, but their numbers continue to grow.
Economic signals are distorted: between 2016 and 2023, transport-related fossil fuel subsidies totaled 1.2 billion USD, lowering fuel prices but transferring costs to society. Externalities are significant, with congestion causing 80% of these costs, followed by crashes and infrastructure damage. Market shifts are slow. Electric vehicle (EV) imports, negligible ten years ago, reached a total value of 9 million USD from 2015 to 2024. By 2024, EVs made up 3% of all road vehicles import in value; the composition mirrors the existing fleet—97% are LDVs. While the transition is underway, it is still confined largely to private cars. UNEP's E-mobility Readiness Index scores Brunei at 59 out of 100, indicating a developing but not yet strong policy framework.
Climate resilience poses an immediate physical threat. Under a 4.5-degree warming scenario, models indicate that more than 100% of the country's road and rail assets are exposed to frequent, extreme precipitation. The financial implications are already visible. Average annual losses to transport infrastructure hover around 4.2 million USD. Roads bear 94% of this burden. Bridges and tunnels, while constituting only 2.0% of the infrastructure stock, absorb a disproportionate 31.1% of the financial damage. The vulnerability is acute.
Social inclusivity metrics reveal a divided landscape. Road safety in Brunei Darussalam remains a significant public health challenge. In 2021, an estimated 9.2 fatalities occurred per 100,000 population due to road crashes, accounting for 10th highest cause of all deaths in the country. Public transport coverage is minimal. In urban agglomerations, only two out of ten residents have convenient access to public transport. For the 18% of the population living more than 30 minutes from a city, connectivity is a lifeline. Yet, 1,000 rural residents remain beyond the reach of all-season roads. Isolation persists. This lack of access leaves pockets of the population vulnerable to shocks, unable to reach healthcare or markets when the rains wash out the tracks.
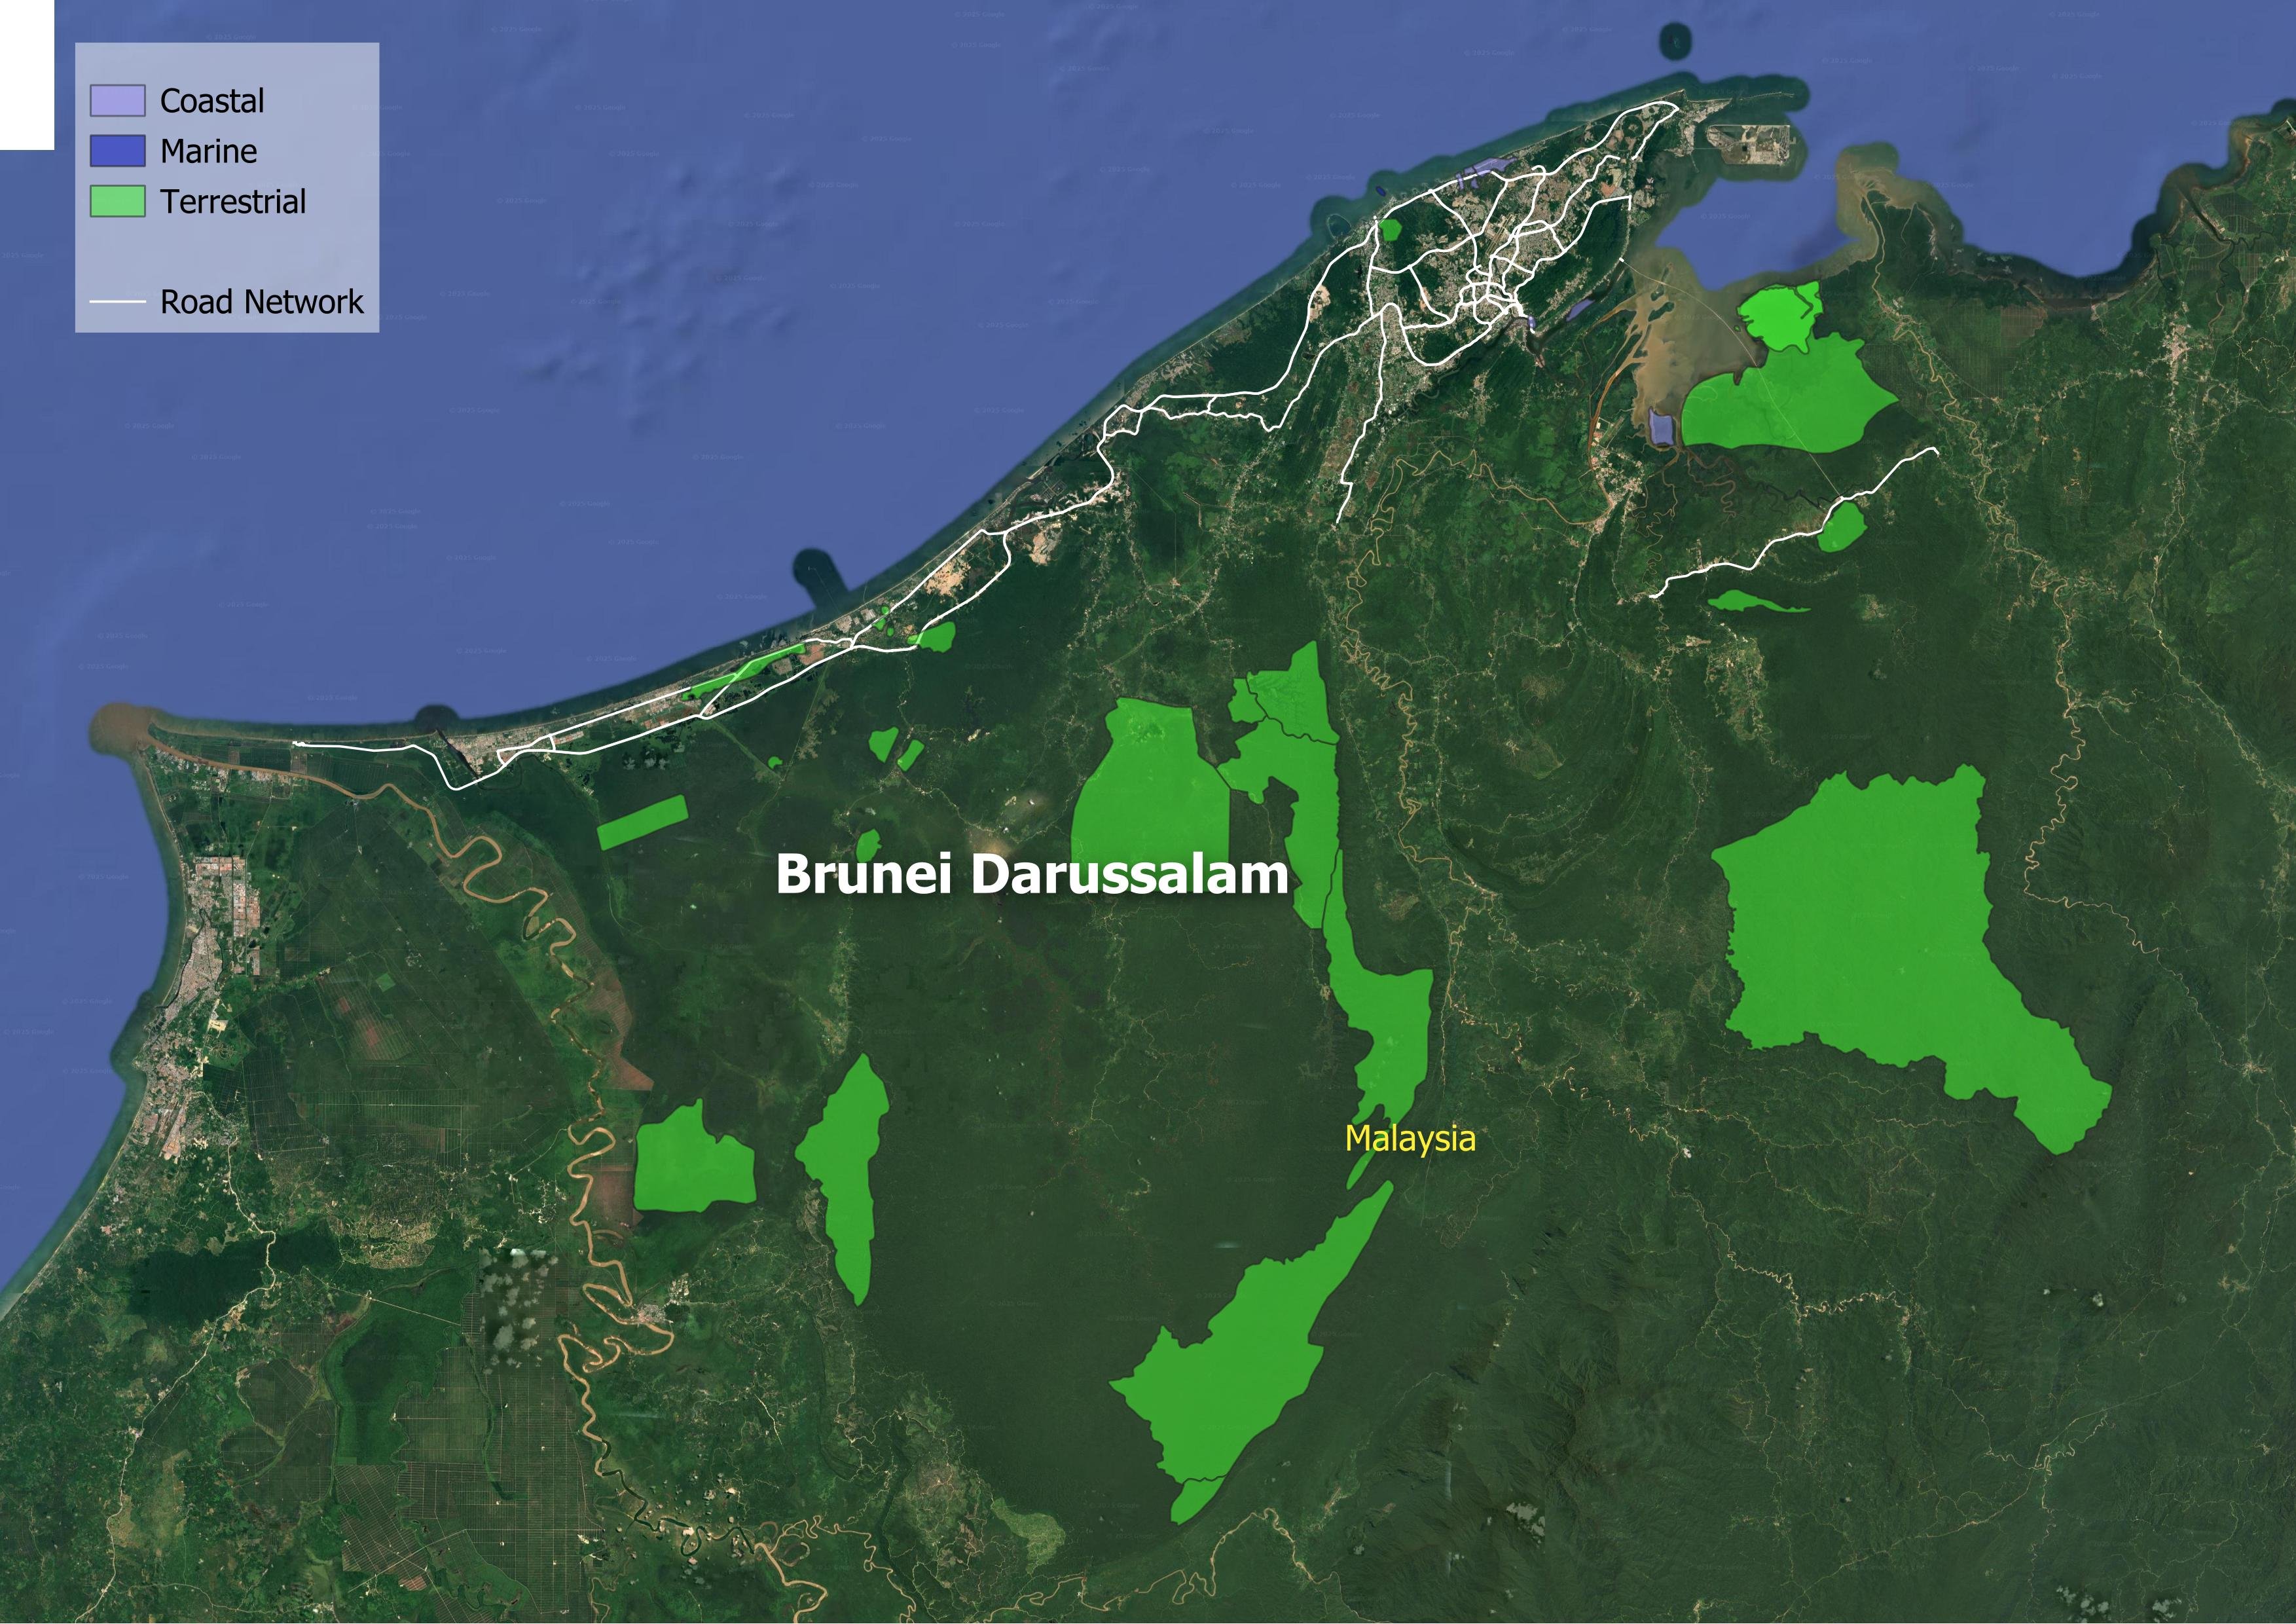
Material consumption reinforces the heavy footprint. The infrastructure stock stands at 31.9 million tonnes. Maintaining and expanding this requires an additional 836,000 tonnes of material annually, embodying 34,000 tonnes of CO2e. Biodiversity also pays a toll, though less than in neighboring states. Three Key Biodiversity Areas contain road infrastructure, equating to 14 meters of road per thousand square kilometers of protected land. This is low compared to the Southeast Asian average of 83, but the intrusion exists.
The workforce powering this sector is shifting. Employment in transport reached 12,000 by 2023. Women hold 29.4% of these roles, a figure that lags behind broader economic participation but shows potential for growth. Households spend 14.9% of their expenditure on transport, a significant portion of the domestic budget, driven by the costs of vehicle ownership.
Brunei Darussalam presents a paradox of high-quality infrastructure and high-carbon dependency. The nation has successfully decoupled some emissions intensity from economic growth, achieving efficiency gains superior to regional peers. However, the absolute dominance of private light-duty vehicles, sustained by significant fossil fuel subsidies, creates a rigid mobility structure that resists deep decarbonization.
Decarbonization
Climate Resilience
Water and Land Management
Reducing Pollution
Preserving Biodiversity
Sustainable Materials Sourcing and Construction Practices
Improving Quality of life
Disaster Preparedness
Fostering Inclusive Growth
Supporting Information
Road Infrastructure Pipeline
| Muara–Tutong Highway Flyover (Tanjung Kajar Industrial Site) | 2023 | 15.2 million BND | None |
Unit Cost Road Projects
Road Transport Policy Landscape
Road Transport Policy Targets
| Strategic Plan for Ministry of Transport and Infocommunications | 2025 | 4800 jobs in land transport sector by 2025 1800 jobs in the aviation sector by 2025 2000 jobs in the maritime sector by 2025 |
| Review to Formulate a Roadmap and Draft National Masterplan for a Sustainable Land Transportation System for Brunei Darussalam | 2035 | 140 Km of new road |
| Review to Formulate a Roadmap and Draft National Masterplan for a Sustainable Land Transportation System for Brunei Darussalam | 2035 | 25 km of upgraded road |
| Review to Formulate a Roadmap and Draft National Masterplan for a Sustainable Land Transportation System for Brunei Darussalam | 2035 | reduce the proportion of journeys by any mode being more than 30 minutes by over 40%; |
Road Transport Policy Measure Types
References
AIIB. (n.d.). MEASURING TRANSPORT CONNECTIVITY FOR TRADE IN ASIA. https://impact.economist.com/perspectives/sites/default/files/eco141_aiib_transport_connectivity_4.pdf/
Asian Transport Observatory. (2025). Asia and the Pacific's Transport Infrastructure and Investment Outlook 2035. https://asiantransportobservatory.org/analytical-outputs/asia-transport-infrastructure-investment-needs/
Barrington-Leigh, C., & Millard-Ball, A. (2025). A high-resolution global time series of street-network sprawl. https://journals.sagepub.com/doi/10.1177/23998083241306829
CDRI. (2023). Global Infrastructure Risk Model and Resilience Index. https://giri.unepgrid.ch/
CIESIN. (2023a). Rural Access Index [Dataset]. https://sedac.ciesin.columbia.edu/data/set/sdgi-9-1-1-rai-2023
CIESIN. (2023b). SDG Indicator 11.2.1: Urban Access to Public Transport, 2023 Release: Sustainable Development Goal Indicators (SDGI). https://sedac.ciesin.columbia.edu/data/set/sdgi-11-2-1-urban-access-public-transport-2023
EDGAR. (2025). GHG emissions of all world countries: 2025. Publications Office. https://data.europa.eu/doi/10.2760/9816914
Ember. (2024). Electricity Data Explorer [Dataset]. https://ember-energy.org/data/electricity-data-explorer
EM-DAT. (2025). EM-DAT - The international disaster database. https://www.emdat.be/European Commission. (2024). Global Air Pollutant Emissions EDGAR v8.1 [Dataset]. https://edgar.jrc.ec.europa.eu/dataset_ap61#sources
IEA. (n.d.). Fossil Fuel Subsidies. IEA. Retrieved April 19, 2025, from https://www.iea.org/topics/fossil-fuel-subsidies
ILO. (2025). ILOSTAT [Dataset]. https://rplumber.ilo.org/files/website/bulk/indicator.html
ITDP. (2024). The Atlas of Sustainable City Transport. https://atlas.itdp.org/
Koks, E., Rozenberg, J., Tariverdi, M., Dickens, B., Fox, C., Ginkel, K. van, & Hallegatte, S. (2023). A global assessment of national road network vulnerability. Environmental Research: Infrastructure and Sustainability, 3(2), 025008. https://doi.org/10.1088/2634-4505/acd1aa
Liu, K., Wang, Q., Wang, M., & Koks, E. E. (2023). Global transportation infrastructure exposure to the change of precipitation in a warmer world. Nature Communications, 14(1), 2541. https://doi.org/10.1038/s41467-023-38203-3
McDuffie, E. E., Martin, R. V., Spadaro, J. V., Burnett, R., Smith, S. J., O'Rourke, P., Hammer, M. S., van Donkelaar, A., Bindle, L., Shah, V., Jaeglé, L., Luo, G., Yu, F., Adeniran, J. A., Lin, J., & Brauer, M. (2021). Source sector and fuel contributions to ambient PM2.5 and attributable mortality across multiple spatial scales. Nature Communications, 12(1), 3594. https://doi.org/10.1038/s41467-021-23853-y
Parry, S. B., Antung A. Liu,Ian W. H. (2023). IMF Fossil Fuel Subsidies Data: 2023 Update. IMF. https://www.imf.org/en/publications/wp/issues/2023/08/22/imf-fossil-fuel-subsidies-data-2023-update-537281
Simkins, A. T., Beresford, A. E., Buchanan, G. M., Crowe, O., Elliott, W., Izquierdo, P., Patterson, D. J., & Butchart, S. H. M. (2023). A global assessment of the prevalence of current and potential future infrastructure in Key Biodiversity Areas. Biological Conservation, 281, 109953. https://doi.org/10.1016/j.biocon.2023.109953
Sims, M., Stanimirova, R., Neumann, M., Raichuk, A., & Purves, D. (2025). New Data Shows What's Driving Forest Loss Around the World. https://www.wri.org/insights/forest-loss-drivers-data-trends
Trademap. (2025). Trade Map. Trade Map. https://www.trademap.org/Index.aspx
UN DESA. (n.d.). Economic and Environmental Vulnerability Indicators. Retrieved January 26, 2026, from https://policy.desa.un.org/themes/least-developed-countries-category/ldc-identification-criteria-indicators/evi-indicators
UN DESA. (2025). 2024 Revision of World Population Prospects. https://population.un.org/wpp/
UN Energy Statistics. (2025). Energy Balance Visualization [Dataset]. https://unstats.un.org/unsd/energystats/dataPortal/
UNEP. (2021, May 12). Domestic material consumption (DMC) and DMC per capita, per GDP (Tier I). https://www.unep.org/indicator-1222
Weiss, D. J., Nelson, A., Gibson, H. S., Temperley, W., Peedell, S., Lieber, A., Hancher, M., Poyart, E., Belchior, S., Fullman, N., Mappin, B., Dalrymple, U., Rozier, J., Lucas, T. C. D., Howes, R. E., Tusting, L. S., Kang, S. Y., Cameron, E., Bisanzio, D., … Gething, P. W. (2018). A global map of travel time to cities to assess inequalities in accessibility in 2015. Nature, 553(7688), 333-336. https://doi.org/10.1038/nature25181
WHO. (2023). Global Status Report on Road Safety 2023. https://www.who.int/teams/social-determinants-of-health/safety-and-mobility/global-status-report-on-road-safety-2023
Wiedenhofer, D., Baumgart, A., Matej, S., Virág, D., Kalt, G., Lanau, M., Tingley, D. D., Liu, Z., Guo, J., Tanikawa, H., & Haberl, H. (2024). Mapping and modelling global mobility infrastructure stocks, material flows and their embodied greenhouse gas emissions [Dataset]. https://doi.org/10.1016/j.jclepro.2023.139742
World Bank. (2021). ICP 2021. https://databank.worldbank.org/source/icp-2021
World Bank. (2022a). Annual freshwater withdrawals, total (% of internal resources) [Dataset]. https://data.worldbank.org
World Bank. (2022b). Land area (sq. Km) [Dataset]. https://data.worldbank.org
World Bank. (2022c). The Global Health Cost of PM2.5 Air Pollution: A Case for Action Beyond 2021. The World Bank. https://doi.org/10.1596/978-1-4648-1816-5
World Bank. (2023). Forest area (% of land area) [Dataset]. https://data.worldbank.org/indicator/AG.LND.FRST.ZS
World Bank. (2024). Home | Logistics Performance Index (LPI). Logistics Performance Index. https://lpi.worldbank.org/
World Bank. (2025a). GDP per capita, PPP (current international $) [Dataset]. https://data.worldbank.org/indicator/NY.GDP.PCAP.PP.CD
World Bank. (2025b). GDP, PPP (current international $) [Dataset]. https://data.worldbank.org/indicator/NY.GDP.MKTP.PP.CD
World Database on Protected Areas. (2024). Protected Areas (WDPA) [Dataset]. https://www.protectedplanet.net/en/thematic-areas/wdpa?tab=WDPA