
Bhutan Green Roads Profile 2025
BHUTAN
GREEN ROADS PROFILESupported by:
The ATO green roads profiles present country-level perspectives on how 35 Asia-Pacific economies are addressing the development and management of sustainable eco-friendly roads. Drawing from diverse datasets and policy documents, the profiles highlight practices and measures that contribute to greener transport infrastructure.
Developed by the Asian Transport Observatory (ATO) in partnership with the International Road Federation (IRF), the profiles are designed to complement the Green Roads Toolkit. The toolkit provides a practical reference for integrating good practices across nine dimensions:
- Decarbonization
- Climate resilience
- Water and land management
- Pollution reduction
- Conserving biodiversity
- Responsible sourcing of materials
- Improving quality of life
- Disaster preparedness
- Fostering inclusive growth
This 2025 edition builds on earlier work to provide a comprehensive resource for guiding the planning, development, construction, and management of greener, more sustainable roads.
Background
Indicator - Dimension Matrix

Bhutan is a sanctuary with 72% forest cover and mostly clear air. However, the asphalt roads running through these mountains present a conflicting reality. The country's 18,500 km of roads act as its economic lifeline, yet they are becoming increasingly fragile. Though the road density is low at 485 meters per square kilometer, their environmental and social impacts are growing disproportionately.
The vehicle fleet is small, with 171 vehicles per 1,000 people—much lower than the Asia-Pacific average of 317. Still, the vehicle mix is skewed, with 59% being light-duty vehicles and 22% trucks. Public transport is nearly absent, with buses making up only 2%. Relying heavily on private fossil-fuel vehicles has significant consequences beyond these figures.
Road transport emissions reached 220,000 tonnes of CO2e in 2024, and this number is rising rapidly. Since 2000, emissions from road transport have grown at an average annual rate of 7.4%, outpacing the overall economic growth of 3.1%. Although efficiency has improved—emissions per unit dropped by 4.7% annually since 2015—the total carbon footprint continues to expand, driven by volume. Fossil fuel subsidies distort the market and hide the true costs per kilometer.
The Himalayan terrain complicates infrastructure development. Building in these mountains is costly, affecting stability and incurring an estimated annual climate-related damage cost of $4 million. Bridges and tunnels, though representing only 0.2% of the infrastructure, bear the brunt of the damage. Future risks include increased exposure to extreme precipitation, affecting more than a third of the road network under a 4.5-degree warming scenario.
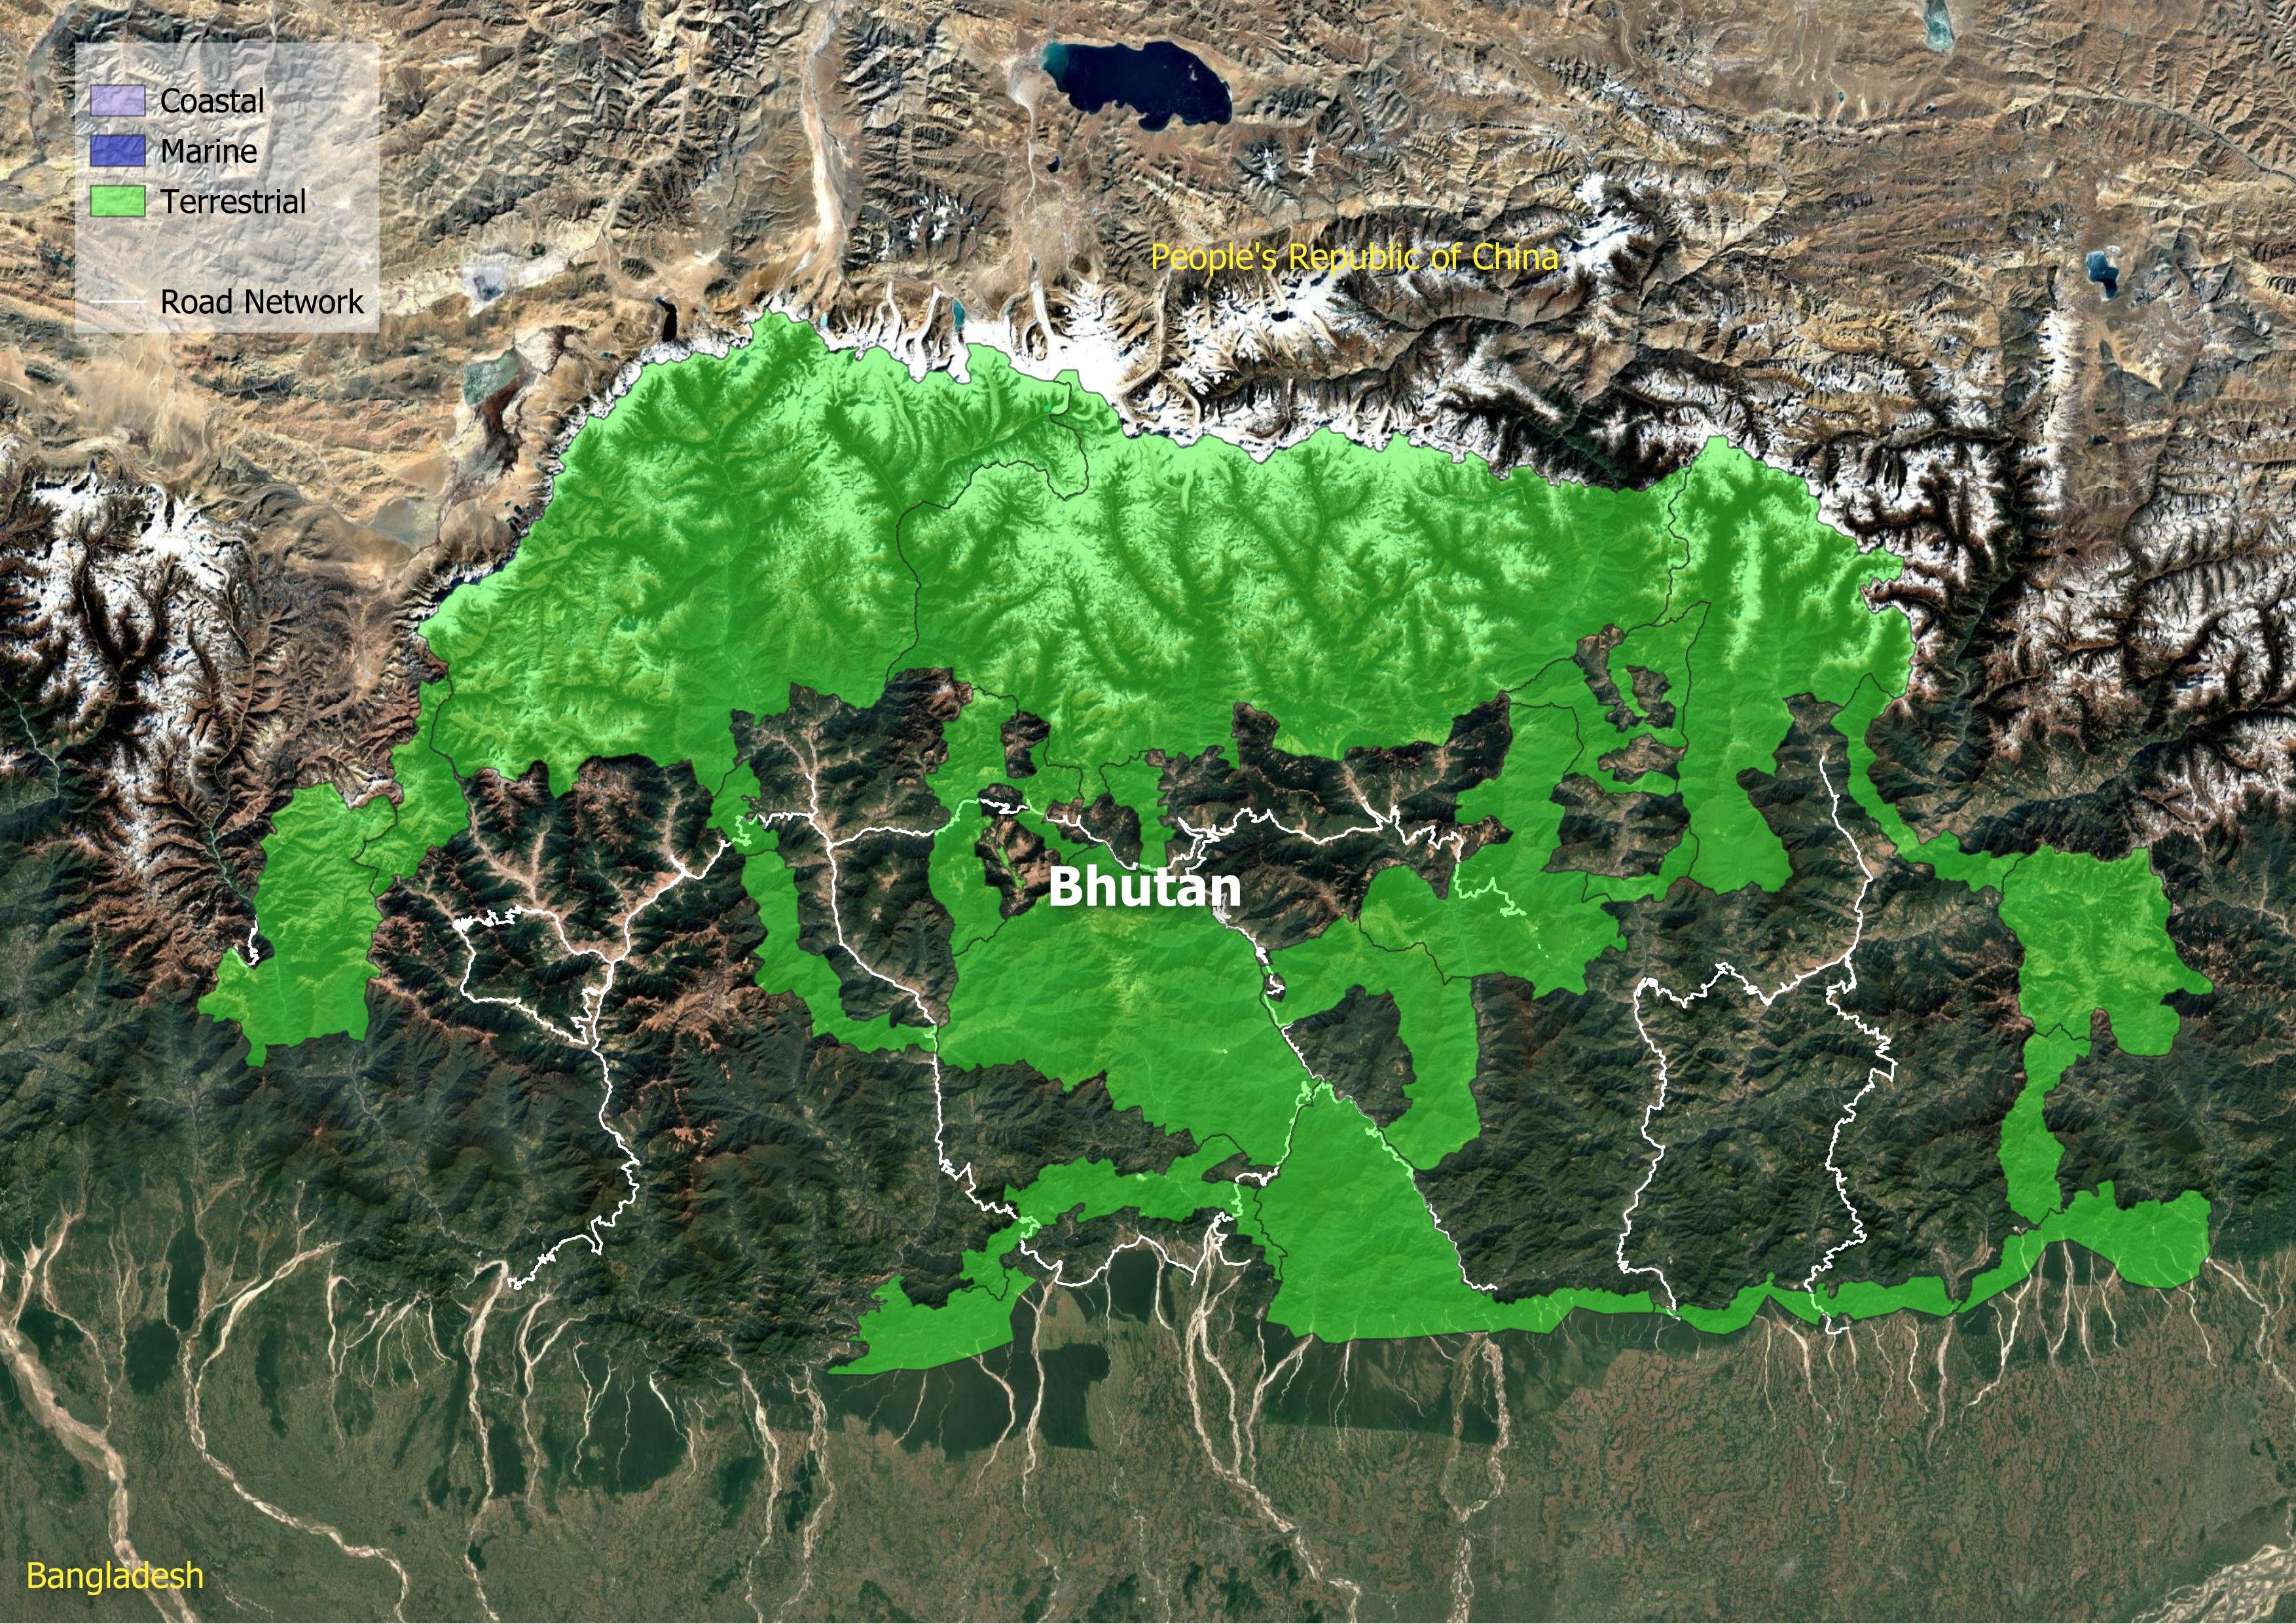
Ecological concerns arise with the road network intersecting Bhutan's Key Biodiversity Areas (KBAs). Roads pass through 20 of the 25 KBAs, leading to fragmentation. Despite a lower-than-regional average density, these zones face higher ecological risks at 42 meters per square kilometer. Large forest areas are shrinking into narrow wildlife corridors.
Access to roads remains a binary issue: either available or not. For 178,000 rural residents, the nearest all-season road is more than two kilometers away—a barrier in the mountains that isolates them from essential services and leaves them vulnerable during earthquakes and heavy rains. Conversely, urban areas face congestion, with 84% of residents spending over 30 minutes to reach major centers.
Economically vital, the transport sector accounts for 8.1% of household expenses and employs 18,000 people. However, women hold just 6.6% of these jobs. Road safety is a concern, with 95 lives lost in 2021. In Bhutan, road crash fatalities decreased by approximately -7.6% per year between 2016 and 2021. Bhutan will be able to halve its road crash fatalities by 2030 with this pace.
Bhutan is increasingly challenged to align its transport sector with its goal of being carbon negative. Road emissions have risen by 7.4 percent, outpacing overall economic growth, indicating that emissions are not decoupling from development. The road infrastructure is also highly susceptible to extreme weather, causing ongoing damage and losses. This situation demands a strategic shift towards climate-resilient, adaptive infrastructure instead of expansion-focused projects. Although there has been progress, nearly 20% of Bhutan's rural population still lacks all-season road access, worsening social and economic inequalities. Additionally, construction in key biodiversity areas has caused ecological harm, highlighting the urgent need for better environmental planning and ecological engineering standards.
Decarbonization
Climate Resilience
Water and Land Management
Reducing Pollution
Preserving Biodiversity
Sustainable Materials Sourcing and Construction Practices
Improving Quality of life
Disaster Preparedness
Fostering Inclusive Growth
Supporting Information
Road Infrastructure Pipeline
| South Asia Subregional Economic Cooperation Transport, Trade Facilitation and Logistics Project | 2016 | 23.07 million USD | 61.3 |
Unit Cost Road Projects
Road Transport Policy Landscape
Road Transport Policy Targets
| Low Emission Development Strategy (LEDS) - Surface Transport | 2050 | • 18,515 public bicycles by 2050 • 1,850 docking stations by 2050 • >75% of urban road should be covered with dedicated NMT tracks Construct min. 10 km of footpath every year |
| Low Emission Development Strategy (LEDS) - Surface Transport | 2030 | • Develop and implement parking ‘de-growth’ plan in consonance with target of no more than 5,500 new vehicles per year, post 2030, permitted to register • Achieve 50% of parking ‘de-growth’ in preparation for gradual phasing out ICE passenger vehicles • 100% parking slots with parking turnover more than 5 in major urban areas should be digitised by 2030 |
Road Transport Policy Measure Types
References
AIIB. (n.d.). MEASURING TRANSPORT CONNECTIVITY FOR TRADE IN ASIA. https://impact.economist.com/perspectives/sites/default/files/eco141_aiib_transport_connectivity_4.pdf/
Asian Transport Observatory. (2025). Asia and the Pacific's Transport Infrastructure and Investment Outlook 2035. https://asiantransportobservatory.org/analytical-outputs/asia-transport-infrastructure-investment-needs/
Barrington-Leigh, C., & Millard-Ball, A. (2025). A high-resolution global time series of street-network sprawl. https://journals.sagepub.com/doi/10.1177/23998083241306829
CDRI. (2023). Global Infrastructure Risk Model and Resilience Index. https://giri.unepgrid.ch/
CIESIN. (2023a). Rural Access Index [Dataset]. https://sedac.ciesin.columbia.edu/data/set/sdgi-9-1-1-rai-2023
CIESIN. (2023b). SDG Indicator 11.2.1: Urban Access to Public Transport, 2023 Release: Sustainable Development Goal Indicators (SDGI). https://sedac.ciesin.columbia.edu/data/set/sdgi-11-2-1-urban-access-public-transport-2023
EDGAR. (2025). GHG emissions of all world countries: 2025. Publications Office. https://data.europa.eu/doi/10.2760/9816914
Ember. (2024). Electricity Data Explorer [Dataset]. https://ember-energy.org/data/electricity-data-explorer
EM-DAT. (2025). EM-DAT - The international disaster database. https://www.emdat.be/European Commission. (2024). Global Air Pollutant Emissions EDGAR v8.1 [Dataset]. https://edgar.jrc.ec.europa.eu/dataset_ap61#sources
IEA. (n.d.). Fossil Fuel Subsidies. IEA. Retrieved April 19, 2025, from https://www.iea.org/topics/fossil-fuel-subsidies
ILO. (2025). ILOSTAT [Dataset]. https://rplumber.ilo.org/files/website/bulk/indicator.html
ITDP. (2024). The Atlas of Sustainable City Transport. https://atlas.itdp.org/
Koks, E., Rozenberg, J., Tariverdi, M., Dickens, B., Fox, C., Ginkel, K. van, & Hallegatte, S. (2023). A global assessment of national road network vulnerability. Environmental Research: Infrastructure and Sustainability, 3(2), 025008. https://doi.org/10.1088/2634-4505/acd1aa
Liu, K., Wang, Q., Wang, M., & Koks, E. E. (2023). Global transportation infrastructure exposure to the change of precipitation in a warmer world. Nature Communications, 14(1), 2541. https://doi.org/10.1038/s41467-023-38203-3
McDuffie, E. E., Martin, R. V., Spadaro, J. V., Burnett, R., Smith, S. J., O'Rourke, P., Hammer, M. S., van Donkelaar, A., Bindle, L., Shah, V., Jaeglé, L., Luo, G., Yu, F., Adeniran, J. A., Lin, J., & Brauer, M. (2021). Source sector and fuel contributions to ambient PM2.5 and attributable mortality across multiple spatial scales. Nature Communications, 12(1), 3594. https://doi.org/10.1038/s41467-021-23853-y
Parry, S. B., Antung A. Liu,Ian W. H. (2023). IMF Fossil Fuel Subsidies Data: 2023 Update. IMF. https://www.imf.org/en/publications/wp/issues/2023/08/22/imf-fossil-fuel-subsidies-data-2023-update-537281
Simkins, A. T., Beresford, A. E., Buchanan, G. M., Crowe, O., Elliott, W., Izquierdo, P., Patterson, D. J., & Butchart, S. H. M. (2023). A global assessment of the prevalence of current and potential future infrastructure in Key Biodiversity Areas. Biological Conservation, 281, 109953. https://doi.org/10.1016/j.biocon.2023.109953
Sims, M., Stanimirova, R., Neumann, M., Raichuk, A., & Purves, D. (2025). New Data Shows What's Driving Forest Loss Around the World. https://www.wri.org/insights/forest-loss-drivers-data-trends
Trademap. (2025). Trade Map. Trade Map. https://www.trademap.org/Index.aspx
UN DESA. (n.d.). Economic and Environmental Vulnerability Indicators. Retrieved January 26, 2026, from https://policy.desa.un.org/themes/least-developed-countries-category/ldc-identification-criteria-indicators/evi-indicators
UN DESA. (2025). 2024 Revision of World Population Prospects. https://population.un.org/wpp/
UN Energy Statistics. (2025). Energy Balance Visualization [Dataset]. https://unstats.un.org/unsd/energystats/dataPortal/
UNEP. (2021, May 12). Domestic material consumption (DMC) and DMC per capita, per GDP (Tier I). https://www.unep.org/indicator-1222
Weiss, D. J., Nelson, A., Gibson, H. S., Temperley, W., Peedell, S., Lieber, A., Hancher, M., Poyart, E., Belchior, S., Fullman, N., Mappin, B., Dalrymple, U., Rozier, J., Lucas, T. C. D., Howes, R. E., Tusting, L. S., Kang, S. Y., Cameron, E., Bisanzio, D., … Gething, P. W. (2018). A global map of travel time to cities to assess inequalities in accessibility in 2015. Nature, 553(7688), 333-336. https://doi.org/10.1038/nature25181
WHO. (2023). Global Status Report on Road Safety 2023. https://www.who.int/teams/social-determinants-of-health/safety-and-mobility/global-status-report-on-road-safety-2023
Wiedenhofer, D., Baumgart, A., Matej, S., Virág, D., Kalt, G., Lanau, M., Tingley, D. D., Liu, Z., Guo, J., Tanikawa, H., & Haberl, H. (2024). Mapping and modelling global mobility infrastructure stocks, material flows and their embodied greenhouse gas emissions [Dataset]. https://doi.org/10.1016/j.jclepro.2023.139742
World Bank. (2021). ICP 2021. https://databank.worldbank.org/source/icp-2021
World Bank. (2022a). Annual freshwater withdrawals, total (% of internal resources) [Dataset]. https://data.worldbank.org
World Bank. (2022b). Land area (sq. Km) [Dataset]. https://data.worldbank.org
World Bank. (2022c). The Global Health Cost of PM2.5 Air Pollution: A Case for Action Beyond 2021. The World Bank. https://doi.org/10.1596/978-1-4648-1816-5
World Bank. (2023). Forest area (% of land area) [Dataset]. https://data.worldbank.org/indicator/AG.LND.FRST.ZS
World Bank. (2024). Home | Logistics Performance Index (LPI). Logistics Performance Index. https://lpi.worldbank.org/
World Bank. (2025a). GDP per capita, PPP (current international $) [Dataset]. https://data.worldbank.org/indicator/NY.GDP.PCAP.PP.CD
World Bank. (2025b). GDP, PPP (current international $) [Dataset]. https://data.worldbank.org/indicator/NY.GDP.MKTP.PP.CD
World Database on Protected Areas. (2024). Protected Areas (WDPA) [Dataset]. https://www.protectedplanet.net/en/thematic-areas/wdpa?tab=WDPA