
Bangladesh Green Roads Profile 2025
BANGLADESH
GREEN ROADS PROFILESupported by:
The ATO green roads profiles present country-level perspectives on how 35 Asia-Pacific economies are addressing the development and management of sustainable eco-friendly roads. Drawing from diverse datasets and policy documents, the profiles highlight practices and measures that contribute to greener transport infrastructure.
Developed by the Asian Transport Observatory (ATO) in partnership with the International Road Federation (IRF), the profiles are designed to complement the Green Roads Toolkit. The toolkit provides a practical reference for integrating good practices across nine dimensions:
- Decarbonization
- Climate resilience
- Water and land management
- Pollution reduction
- Conserving biodiversity
- Responsible sourcing of materials
- Improving quality of life
- Disaster preparedness
- Fostering inclusive growth
This 2025 edition builds on earlier work to provide a comprehensive resource for guiding the planning, development, construction, and management of greener, more sustainable roads.
Background
Indicator - Dimension Matrix

Bangladesh exemplifies a densely populated country. With 173.6 million residents spread over roughly 130,000 square kilometers, land pressure is intense. The country has expanded its road network to 482,400 kilometers by 2024, resulting in a physical density of 3,706 meters of road per square kilometer, indicating high connectivity. However, road availability per person remains low, with only 2.8 kilometers per thousand people, declining from 3.3 km in 2000. Infrastructure struggles to keep pace with population growth.
The vehicles on this network are mainly two-wheelers, unlike other parts of Asia-Pacific dominated by heavy four-wheelers. Motorization is low at 32 vehicles per thousand people, compared to the regional average of 317. Consequently, 59% of vehicles are motorbikes, and 21% are light-duty vehicles. Trucks and buses make up smaller, but more emission-intensive, shares. This low motorization results in very efficient road transport emissions — just 6 grams of CO2e per USD of GDP, compared to the regional average of 26 grams.
Yet, this efficiency is fragile. Total emissions are rising fast, with road transport emissions reaching 10.5 million tonnes of CO2e in 2024, growing at 6.5% annually since 2000 — nearly twice the economy-wide growth rate. Electric mobility is developing, with $596 million worth of EV imports since 2015, but its decarbonization potential is limited by the electricity grid, which emits 694 g CO2 per kWh — much higher than the Asia-Pacific average of 559. An EV in Dhaka is only as clean as the power plant that supplies it.
The vulnerability of the transport network is real and immediate. Bangladesh loses about $179 million annually due to infrastructure damage, mostly roads. Bridges and tunnels, though only 0.4% of the network, account for 2.2% of these losses. Under a 4.5°C warming scenario, 19% of road and rail infrastructure could be exposed to extreme rainfall, causing water damage and pavement failure.
The human toll of the current system is severe. Air pollution caused by transport led to a PM 2.5 level of 62.6 micrograms per cubic meter in 2019, resulting in 6,500 early deaths. The health-related economic loss is estimated at $70.8 billion, about 9% of GDP. Road safety is a crisis, with WHO reporting 31,578 fatalities in 2021. In Bangladesh, road crash fatalities increased by approximately 4.8% per year between 2016 and 2021. If this pattern persists, the gap between current trends and the 2030 target will only widen.
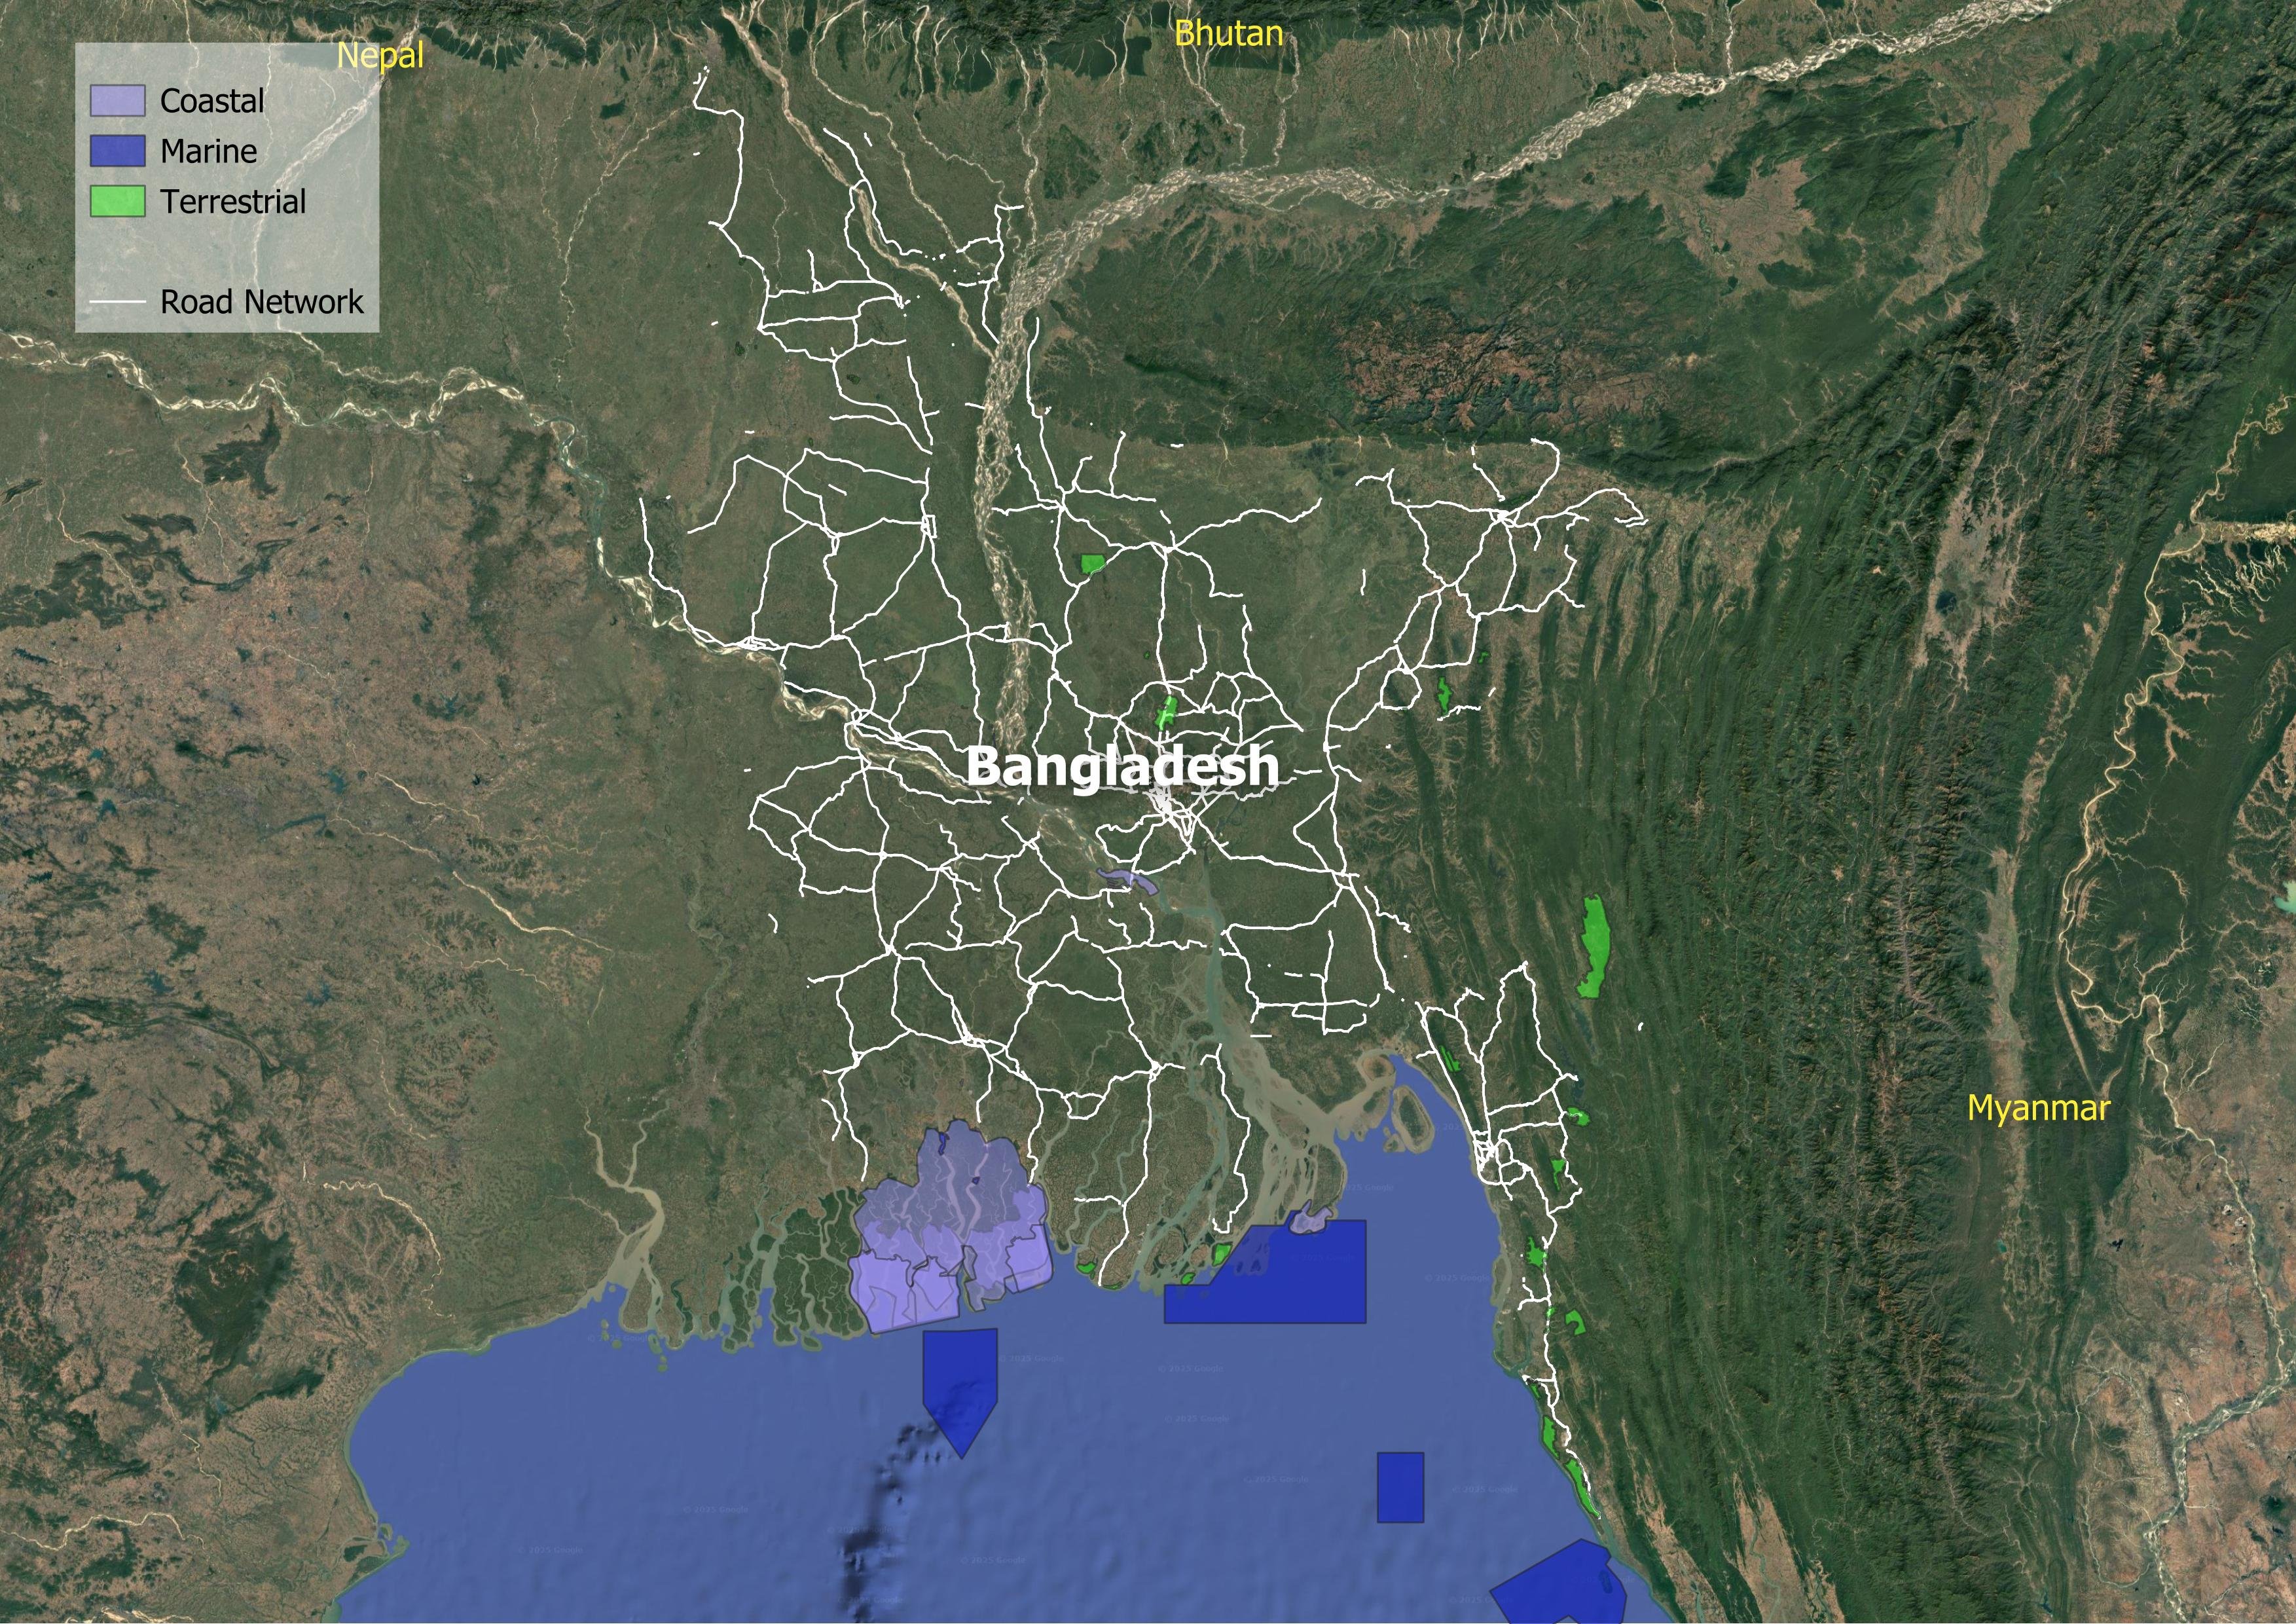
Inclusivity remains the final, critical gap. Despite the high road density, the network is porous. 17 million rural residents remain cut off from all-season roads, leaving the most vulnerable susceptible to shocks and slow recovery during disasters. The sector is also completely gender-imbalanced, with women comprising a mere 2.7% of the transport workforce. Meanwhile, nature retreats. In the country's 20 Key Biodiversity Areas, nine have already been bisected by infrastructure.
Bangladesh faces a crucial moment. Its high infrastructure density masks underlying issues. The country benefits from low carbon emissions but faces increasing total emissions and climate risks. Continuing current trends — high accident rates, health costs from pollution, and rural disconnection — threatens the economic benefits of network expansion.
Decarbonization
Climate Resilience
Water and Land Management
Reducing Pollution
Preserving Biodiversity
Sustainable Materials Sourcing and Construction Practices
Improving Quality of life
Disaster Preparedness
Fostering Inclusive Growth
Supporting Information
Road Infrastructure Pipeline
| Bangladesh Road Safety Project | 2022 | 527 million USD | None |
| Bangladesh: Hatikumrul-Bonpara-Jhenaidah Phase I Road Improvement Project | - | None | 57.2 |
| Bangladesh: Mymensingh Kewatkhali Bridge Project | 2021 | None | None |
| Bangladesh: Rampura-Amulia-Demra (RAD) Expressway Project | 2023 | None | None |
| Bangladesh: Sylhet to Tamabil Road Upgrade Project | 2020 | None | None |
| Chattogram-Coxs Bazar Highway Improvement Project | 2023 | None | None |
| Cross-Border Road Network Improvement Project (Bangladesh) | 2016 | None | None |
| Dhaka Bypass Expressway (Gazipur–Narayanganj) | 2018 | None | None |
| Dhaka Elevated Expressway (Airport–Jatrabari) | 2019 | 1131.7 million USD | 46.7 |
| South Asia Subregional Economic Cooperation Chattogram Port Access Road Improvement Project | 2024 | None | 11.5 |
| South Asia Subregional Economic Cooperation Dhaka-Northwest Corridor Road Project, Phase 2 | 2017 | 1675.6 million USD | None |
| South Asia Subregional Economic Cooperation Dhaka-Northwest Corridor Road Project, Phase 2 - Tranche 1 | 2017 | 471.4 million USD | None |
| South Asia Subregional Economic Cooperation Dhaka-Northwest Corridor Road Project, Phase 2 (Tranche 3) | 2023 | 461.5 million USD | None |
| South Asia Subregional Economic Cooperation Dhaka–Northwest Corridor Road Project, Phase 2 (Tranche 4) | 2025 | None | None |
| South Asia Subregional Economic Cooperation Dhaka–Sylhet Corridor Road Investment Project | 2021 | 2694 million USD | None |
| South Asia Subregional Economic Cooperation Dhaka–Sylhet Corridor Road Investment Project-Tranche 1 | 2021 | 882.9 million USD | 210 |
| Western Bangladesh Bridge Improvement Project | 2015 | None | None |
Road User Charging
| Actual maintenance budget | 580 |
| Required maintenance budget | 2,281 |
| Maintenance budget deficit | 1,702 |
| Tax on sale of vehicle | 1,200 |
| Vehicle registration fee | 94 |
| Motor vehicle tax | 115 |
| Fuel tax | 3,900 |
| Road toll | 101.00 |
Unit Cost Road Projects
Road Transport Policy Landscape
Road Transport Policy Targets
| Mujib Climate Prosperity Plan | 2030 | Construct 10,000 km of bike lanes Construct 10,000 km of footpaths |
| Perspective Plan of Bangladesh 2021-2041 | 2041 | Infrastructure quality: Country ranking = 40 (Baseline, 2018 = 120) Score = 5.0 (Baseline, 2018 = 2.8) |
| Mujib Climate Prosperity Plan | 2025 | Reduce logistics cost by 25% |
| Mujib Climate Prosperity Plan | 2030 | Reduce logistics cost by 50%. |
| Eighth Five Year Plan | 2025 | Target 2025: Construction of 4/6/8 lane roads = 550 km Construction of new roads lane = 150 km Improvement/ Rehabilitation of National Highways = 1800 km Improvement/ Rehabilitation of Regional & Zila Highways = 12,700 km Construction of bridges/culverts = 37,500 meters Reconstruction of bridges/culverts = 4,100 meters Construction of Flyover/Overpass = 11,000 meters Construction of Rigid Pavement = 375 km Weigh Bridge/ Axle Load Control Station = 30 number |
| Perspective Plan of Bangladesh 2021-2041 | 2041 | All village roads would be converted to asphalt standard with at least one lane to facilitate rural mobility of passengers and products. |
| Eighth Five Year Plan | 2025 | Targets 2025: Rehabilitate/ Upgrade 846 km existing rail line. Target 2025: Transport Infrastructure quality Country ranking = 80 Score = 47 Baseline 2019: Transport Infrastructure quality Country ranking = 100 Score = 42 share of Fair to Good road surfaces will be increased from 81% to 90% for overall RHD Road Network |
| Mujib Climate Prosperity Plan | 2030 | Retrofit 13,000 km (approx.) of zilla and upazila (farm to market) roads |
| Bangladesh. National Communication (NC). NC 3 | 2030 | Improveme nt of road traffic congestion % improvement in fuel efficiency High = 15% Medium = 10% Low = 5% |
Road Transport Policy Measure Types
References
AIIB. (n.d.). MEASURING TRANSPORT CONNECTIVITY FOR TRADE IN ASIA. https://impact.economist.com/perspectives/sites/default/files/eco141_aiib_transport_connectivity_4.pdf/
Asian Transport Observatory. (2025). Asia and the Pacific's Transport Infrastructure and Investment Outlook 2035. https://asiantransportobservatory.org/analytical-outputs/asia-transport-infrastructure-investment-needs/
Barrington-Leigh, C., & Millard-Ball, A. (2025). A high-resolution global time series of street-network sprawl. https://journals.sagepub.com/doi/10.1177/23998083241306829
CDRI. (2023). Global Infrastructure Risk Model and Resilience Index. https://giri.unepgrid.ch/
CIESIN. (2023a). Rural Access Index [Dataset]. https://sedac.ciesin.columbia.edu/data/set/sdgi-9-1-1-rai-2023
CIESIN. (2023b). SDG Indicator 11.2.1: Urban Access to Public Transport, 2023 Release: Sustainable Development Goal Indicators (SDGI). https://sedac.ciesin.columbia.edu/data/set/sdgi-11-2-1-urban-access-public-transport-2023
EDGAR. (2025). GHG emissions of all world countries: 2025. Publications Office. https://data.europa.eu/doi/10.2760/9816914
Ember. (2024). Electricity Data Explorer [Dataset]. https://ember-energy.org/data/electricity-data-explorer
EM-DAT. (2025). EM-DAT - The international disaster database. https://www.emdat.be/European Commission. (2024). Global Air Pollutant Emissions EDGAR v8.1 [Dataset]. https://edgar.jrc.ec.europa.eu/dataset_ap61#sources
IEA. (n.d.). Fossil Fuel Subsidies. IEA. Retrieved April 19, 2025, from https://www.iea.org/topics/fossil-fuel-subsidies
ILO. (2025). ILOSTAT [Dataset]. https://rplumber.ilo.org/files/website/bulk/indicator.html
ITDP. (2024). The Atlas of Sustainable City Transport. https://atlas.itdp.org/
Koks, E., Rozenberg, J., Tariverdi, M., Dickens, B., Fox, C., Ginkel, K. van, & Hallegatte, S. (2023). A global assessment of national road network vulnerability. Environmental Research: Infrastructure and Sustainability, 3(2), 025008. https://doi.org/10.1088/2634-4505/acd1aa
Liu, K., Wang, Q., Wang, M., & Koks, E. E. (2023). Global transportation infrastructure exposure to the change of precipitation in a warmer world. Nature Communications, 14(1), 2541. https://doi.org/10.1038/s41467-023-38203-3
McDuffie, E. E., Martin, R. V., Spadaro, J. V., Burnett, R., Smith, S. J., O'Rourke, P., Hammer, M. S., van Donkelaar, A., Bindle, L., Shah, V., Jaeglé, L., Luo, G., Yu, F., Adeniran, J. A., Lin, J., & Brauer, M. (2021). Source sector and fuel contributions to ambient PM2.5 and attributable mortality across multiple spatial scales. Nature Communications, 12(1), 3594. https://doi.org/10.1038/s41467-021-23853-y
Parry, S. B., Antung A. Liu,Ian W. H. (2023). IMF Fossil Fuel Subsidies Data: 2023 Update. IMF. https://www.imf.org/en/publications/wp/issues/2023/08/22/imf-fossil-fuel-subsidies-data-2023-update-537281
Simkins, A. T., Beresford, A. E., Buchanan, G. M., Crowe, O., Elliott, W., Izquierdo, P., Patterson, D. J., & Butchart, S. H. M. (2023). A global assessment of the prevalence of current and potential future infrastructure in Key Biodiversity Areas. Biological Conservation, 281, 109953. https://doi.org/10.1016/j.biocon.2023.109953
Sims, M., Stanimirova, R., Neumann, M., Raichuk, A., & Purves, D. (2025). New Data Shows What's Driving Forest Loss Around the World. https://www.wri.org/insights/forest-loss-drivers-data-trends
Trademap. (2025). Trade Map. Trade Map. https://www.trademap.org/Index.aspx
UN DESA. (n.d.). Economic and Environmental Vulnerability Indicators. Retrieved January 26, 2026, from https://policy.desa.un.org/themes/least-developed-countries-category/ldc-identification-criteria-indicators/evi-indicators
UN DESA. (2025). 2024 Revision of World Population Prospects. https://population.un.org/wpp/
UN Energy Statistics. (2025). Energy Balance Visualization [Dataset]. https://unstats.un.org/unsd/energystats/dataPortal/
UNEP. (2021, May 12). Domestic material consumption (DMC) and DMC per capita, per GDP (Tier I). https://www.unep.org/indicator-1222
Weiss, D. J., Nelson, A., Gibson, H. S., Temperley, W., Peedell, S., Lieber, A., Hancher, M., Poyart, E., Belchior, S., Fullman, N., Mappin, B., Dalrymple, U., Rozier, J., Lucas, T. C. D., Howes, R. E., Tusting, L. S., Kang, S. Y., Cameron, E., Bisanzio, D., … Gething, P. W. (2018). A global map of travel time to cities to assess inequalities in accessibility in 2015. Nature, 553(7688), 333-336. https://doi.org/10.1038/nature25181
WHO. (2023). Global Status Report on Road Safety 2023. https://www.who.int/teams/social-determinants-of-health/safety-and-mobility/global-status-report-on-road-safety-2023
Wiedenhofer, D., Baumgart, A., Matej, S., Virág, D., Kalt, G., Lanau, M., Tingley, D. D., Liu, Z., Guo, J., Tanikawa, H., & Haberl, H. (2024). Mapping and modelling global mobility infrastructure stocks, material flows and their embodied greenhouse gas emissions [Dataset]. https://doi.org/10.1016/j.jclepro.2023.139742
World Bank. (2021). ICP 2021. https://databank.worldbank.org/source/icp-2021
World Bank. (2022a). Annual freshwater withdrawals, total (% of internal resources) [Dataset]. https://data.worldbank.org
World Bank. (2022b). Land area (sq. Km) [Dataset]. https://data.worldbank.org
World Bank. (2022c). The Global Health Cost of PM2.5 Air Pollution: A Case for Action Beyond 2021. The World Bank. https://doi.org/10.1596/978-1-4648-1816-5
World Bank. (2023). Forest area (% of land area) [Dataset]. https://data.worldbank.org/indicator/AG.LND.FRST.ZS
World Bank. (2024). Home | Logistics Performance Index (LPI). Logistics Performance Index. https://lpi.worldbank.org/
World Bank. (2025a). GDP per capita, PPP (current international $) [Dataset]. https://data.worldbank.org/indicator/NY.GDP.PCAP.PP.CD
World Bank. (2025b). GDP, PPP (current international $) [Dataset]. https://data.worldbank.org/indicator/NY.GDP.MKTP.PP.CD
World Database on Protected Areas. (2024). Protected Areas (WDPA) [Dataset]. https://www.protectedplanet.net/en/thematic-areas/wdpa?tab=WDPA