
Azerbaijan Green Roads Profile 2025
AZERBAIJAN
GREEN ROADS PROFILESupported by:
The ATO green roads profiles present country-level perspectives on how 35 Asia-Pacific economies are addressing the development and management of sustainable eco-friendly roads. Drawing from diverse datasets and policy documents, the profiles highlight practices and measures that contribute to greener transport infrastructure.
Developed by the Asian Transport Observatory (ATO) in partnership with the International Road Federation (IRF), the profiles are designed to complement the Green Roads Toolkit. The toolkit provides a practical reference for integrating good practices across nine dimensions:
- Decarbonization
- Climate resilience
- Water and land management
- Pollution reduction
- Conserving biodiversity
- Responsible sourcing of materials
- Improving quality of life
- Disaster preparedness
- Fostering inclusive growth
This 2025 edition builds on earlier work to provide a comprehensive resource for guiding the planning, development, construction, and management of greener, more sustainable roads.
Background
Indicator - Dimension Matrix

The road network, spanning 78.8 thousand kilometers, serves as the circulatory system of the nation's economy, yet it is showing signs of strain. Access is tightening. While the population has grown, the availability of road infrastructure has contracted, falling from 9.2 kilometers per thousand people in 2000 to 7.6 kilometers in 2024. This contraction coincides with an increase in demand. Motorization has climbed to 161 vehicles per thousand people. While this remains roughly half the Asia-Pacific average of 317, the trajectory is steep.
By 2024, road transport emissions hit 9.1 million tonnes of CO2e, accounting for a staggering 92% of the sector's total output. This dominance is absolute. More concerning is the decoupling gap. Since 2000, road transport emissions have increased by 6.1% annually, outpacing the broader economy's 1.6% annual growth.
Efficiency gains are present but sluggish. The emissions intensity of the road sector dropped to 35 grams of CO2e per USD in 2024. However, the pace of improvement—minus 2.1% annually since 2015—lags dangerously behind the regional benchmark. The Asia-Pacific region averaged a 5.4% improvement; Central and West Asia, 3.2%. Azerbaijan is decarbonizing, but at a slow pace. The grid itself offers little salvation for the electrification push. With a carbon intensity of 633 gCO2 per kWh, Azerbaijan's power sector is more polluting than the Asia-Pacific average of 559. An electric vehicle charged here today is only as clean as the gas that powers the turbine.
The tailpipe extracts a heavy price. PM 2.5 emissions from transport contributed to at least 582 premature deaths in a single year. The World Bank estimates the economic damage from ambient and household PM 2.5 exposure at $11.5 billion—nearly 8% of GDP. This is not an externality; it is a direct levy on the economy. The source is clear: 82% of transport-related PM2.5 comes from roads. Since 2015, these emissions have increased by 6.2% annually, reversing the slow progress of the previous decade.
The infrastructure is brittle. Under a 4.5-degree warming scenario, extreme precipitation threatens more than 16% of Azerbaijan's road and rail assets. The financial loss is already underway, with average annual losses to transport infrastructure estimated at $7.1 million. Bridges and tunnels, though a fraction of the network, bear a disproportionate 7.2% of these losses.
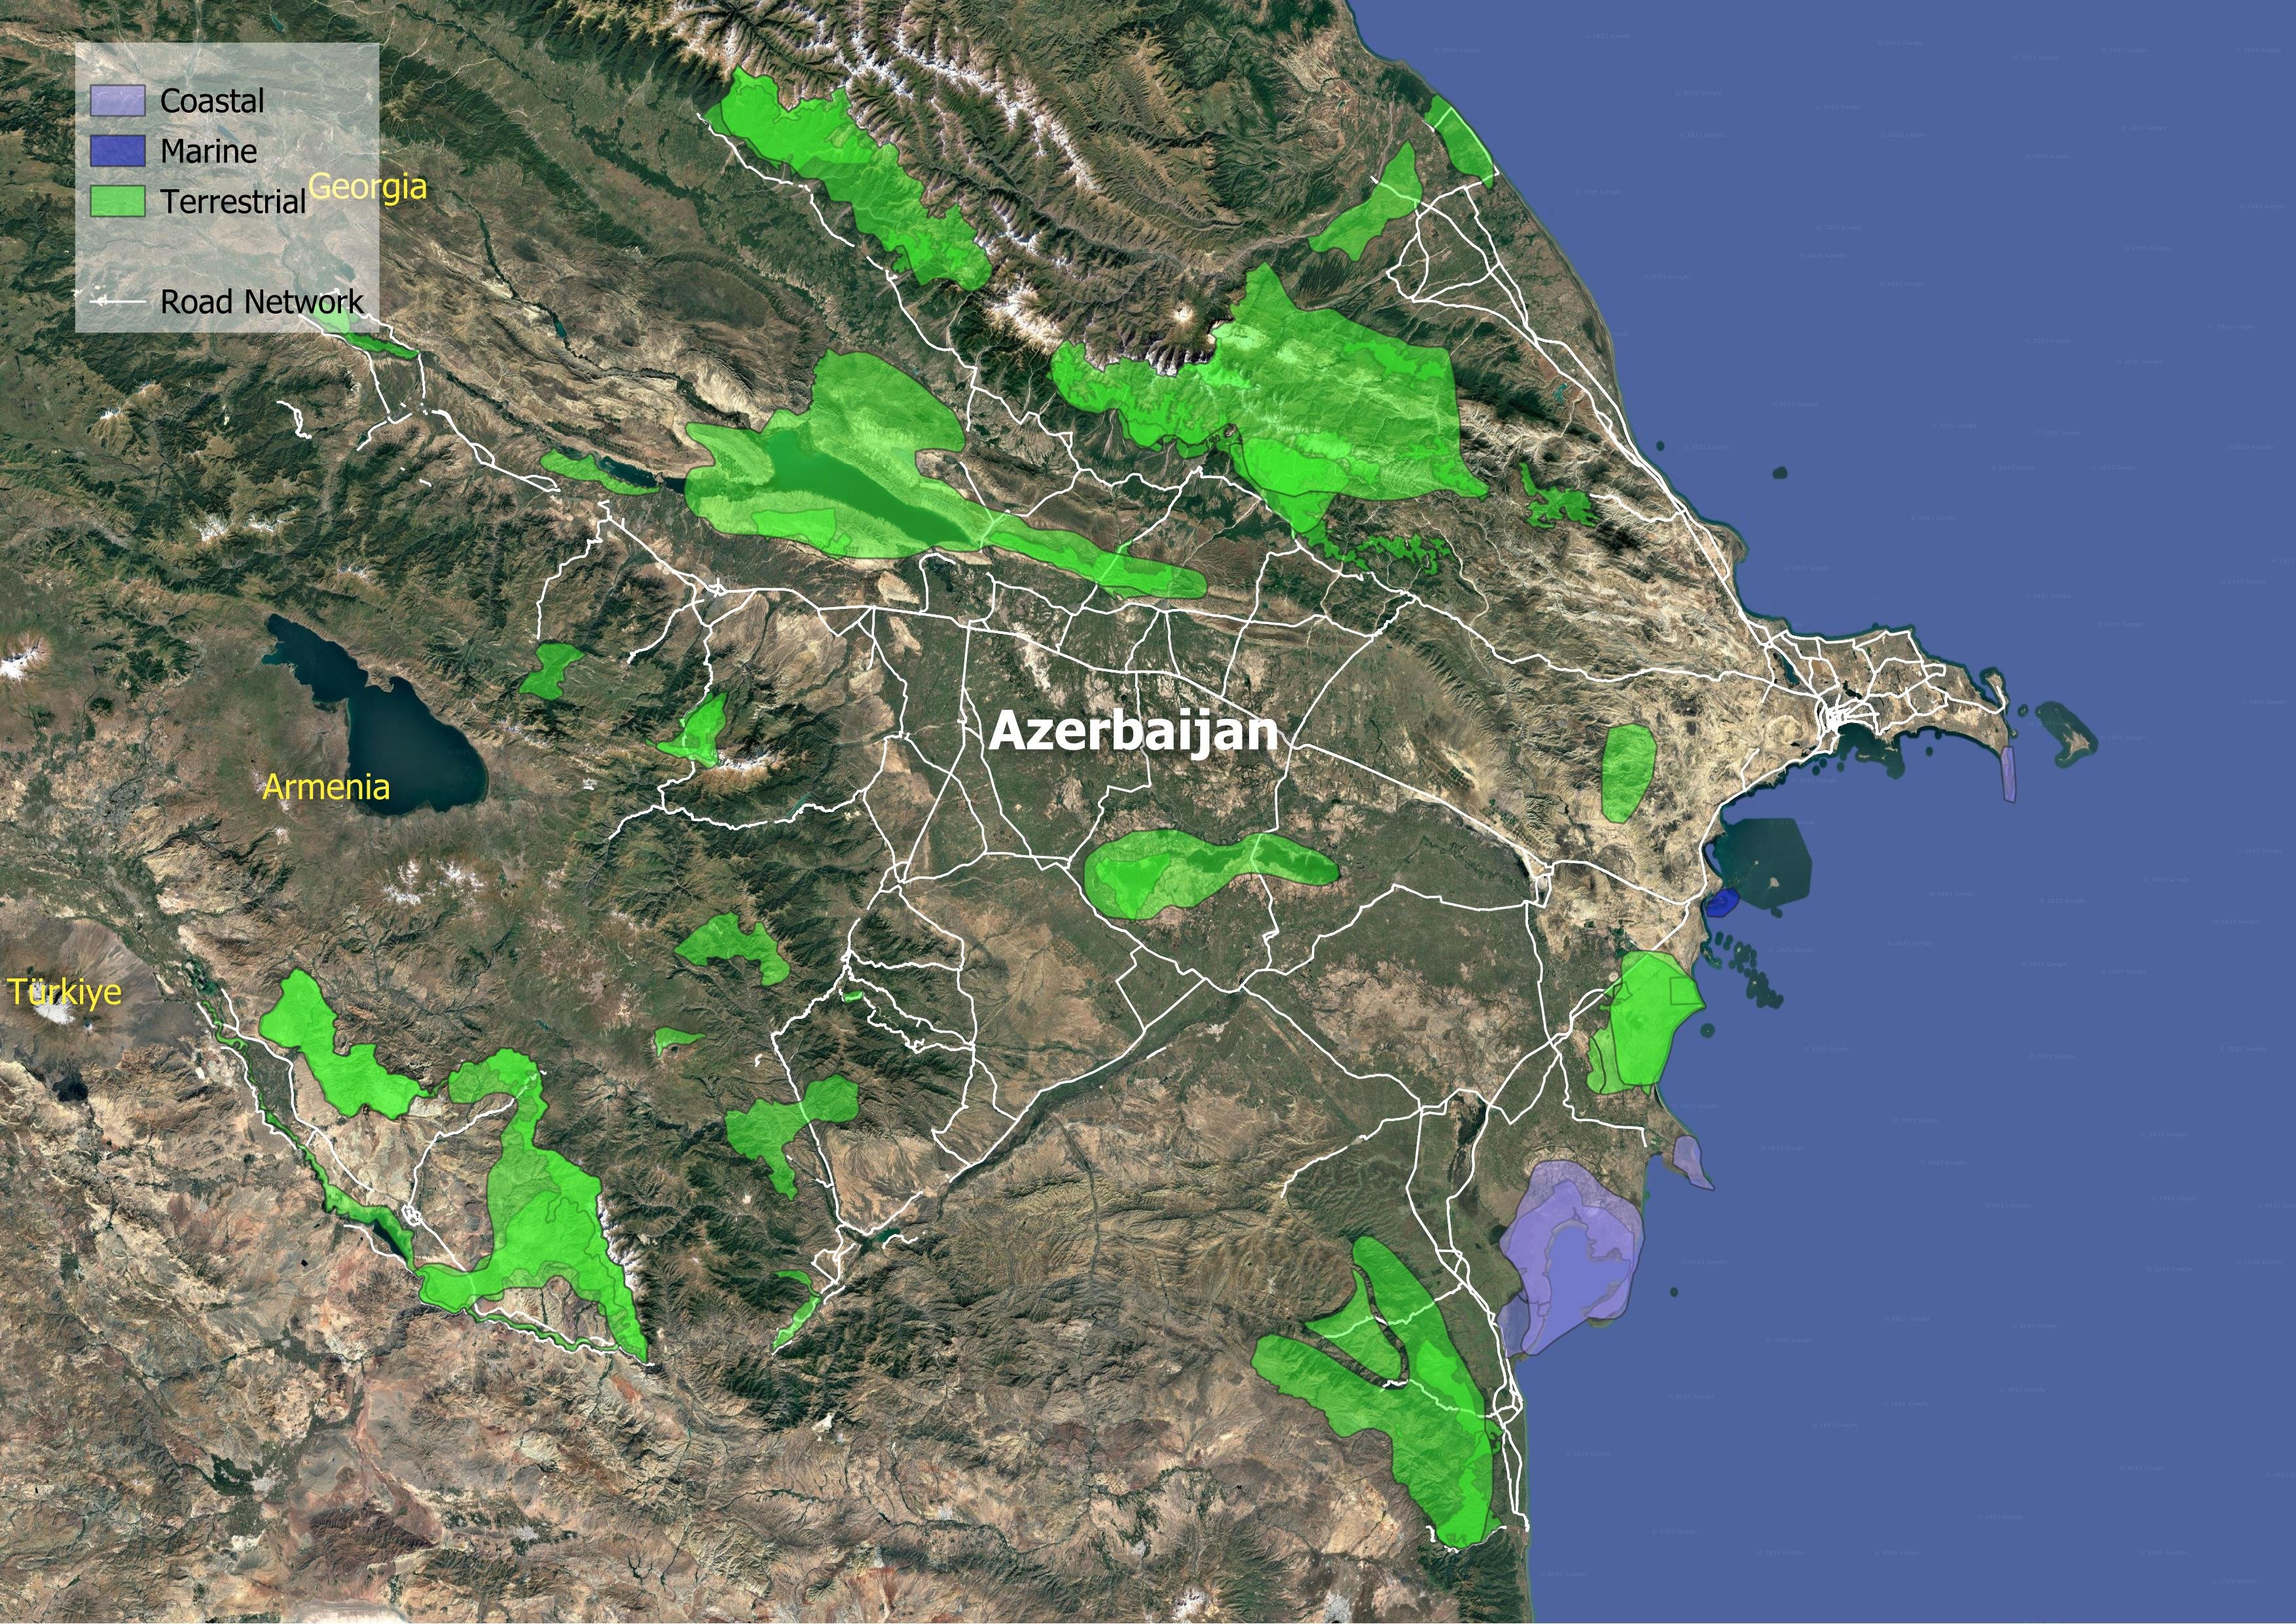
Roads now dissect 48 of the country's 70 Key Biodiversity Areas. The density of intrusion—128 meters of road per thousand square kilometers of protected land—far exceeds the Asia-Pacific average of 88. Connectivity for humans is becoming fragmented for wildlife.
The Access Deficit Connection is not universal. In rural hinterlands, 754,000 people remain beyond the reach of an all-season road. Isolation is their geography. They are cut off from markets, healthcare, and resilience against shocks. The urban picture is equally fractured. Among nine agglomerations, only 11% provide public transport access to half their population. In 56% of cities, only two out of ten residents can reach a transit point. The car remains a necessity, not a choice.
Safety improvements are too slow. Road fatalities claimed 1,769 lives in 2021. In Azerbaijan, road crash fatalities decreased by approximately -3.3% per year between 2016 and 2021. However, this is not enough to reach the 2030 target to halve the fatalities by 2030.
Azerbaijan faces a paradox of mobility: the network is extensive yet insufficient. The road sector is a heavy emitter, lags regional peers in efficiency improvements, and relies on a carbon-intensive grid that dulls the promise of electrification. The external costs—measured in lives lost to pollution, GDP eroded by health damages, and biodiversity fractured by asphalt—are rising.
Decarbonization
Climate Resilience
Water and Land Management
Reducing Pollution
Preserving Biodiversity
Sustainable Materials Sourcing and Construction Practices
Improving Quality of life
Disaster Preparedness
Fostering Inclusive Growth
Supporting Information
Road Infrastructure Pipeline
| Regional Connectivity and Development Project | 2021 | 95.88 million USD | None |
Unit Cost Road Projects
Road Transport Policy Landscape
Road Transport Policy Targets
No data
Road Transport Policy Measure Types
References
AIIB. (n.d.). MEASURING TRANSPORT CONNECTIVITY FOR TRADE IN ASIA. https://impact.economist.com/perspectives/sites/default/files/eco141_aiib_transport_connectivity_4.pdf/
Asian Transport Observatory. (2025). Asia and the Pacific's Transport Infrastructure and Investment Outlook 2035. https://asiantransportobservatory.org/analytical-outputs/asia-transport-infrastructure-investment-needs/
Barrington-Leigh, C., & Millard-Ball, A. (2025). A high-resolution global time series of street-network sprawl. https://journals.sagepub.com/doi/10.1177/23998083241306829
CDRI. (2023). Global Infrastructure Risk Model and Resilience Index. https://giri.unepgrid.ch/
CIESIN. (2023a). Rural Access Index [Dataset]. https://sedac.ciesin.columbia.edu/data/set/sdgi-9-1-1-rai-2023
CIESIN. (2023b). SDG Indicator 11.2.1: Urban Access to Public Transport, 2023 Release: Sustainable Development Goal Indicators (SDGI). https://sedac.ciesin.columbia.edu/data/set/sdgi-11-2-1-urban-access-public-transport-2023
EDGAR. (2025). GHG emissions of all world countries: 2025. Publications Office. https://data.europa.eu/doi/10.2760/9816914
Ember. (2024). Electricity Data Explorer [Dataset]. https://ember-energy.org/data/electricity-data-explorer
EM-DAT. (2025). EM-DAT - The international disaster database. https://www.emdat.be/European Commission. (2024). Global Air Pollutant Emissions EDGAR v8.1 [Dataset]. https://edgar.jrc.ec.europa.eu/dataset_ap61#sources
IEA. (n.d.). Fossil Fuel Subsidies. IEA. Retrieved April 19, 2025, from https://www.iea.org/topics/fossil-fuel-subsidies
ILO. (2025). ILOSTAT [Dataset]. https://rplumber.ilo.org/files/website/bulk/indicator.html
ITDP. (2024). The Atlas of Sustainable City Transport. https://atlas.itdp.org/
Koks, E., Rozenberg, J., Tariverdi, M., Dickens, B., Fox, C., Ginkel, K. van, & Hallegatte, S. (2023). A global assessment of national road network vulnerability. Environmental Research: Infrastructure and Sustainability, 3(2), 025008. https://doi.org/10.1088/2634-4505/acd1aa
Liu, K., Wang, Q., Wang, M., & Koks, E. E. (2023). Global transportation infrastructure exposure to the change of precipitation in a warmer world. Nature Communications, 14(1), 2541. https://doi.org/10.1038/s41467-023-38203-3
McDuffie, E. E., Martin, R. V., Spadaro, J. V., Burnett, R., Smith, S. J., O'Rourke, P., Hammer, M. S., van Donkelaar, A., Bindle, L., Shah, V., Jaeglé, L., Luo, G., Yu, F., Adeniran, J. A., Lin, J., & Brauer, M. (2021). Source sector and fuel contributions to ambient PM2.5 and attributable mortality across multiple spatial scales. Nature Communications, 12(1), 3594. https://doi.org/10.1038/s41467-021-23853-y
Parry, S. B., Antung A. Liu,Ian W. H. (2023). IMF Fossil Fuel Subsidies Data: 2023 Update. IMF. https://www.imf.org/en/publications/wp/issues/2023/08/22/imf-fossil-fuel-subsidies-data-2023-update-537281
Simkins, A. T., Beresford, A. E., Buchanan, G. M., Crowe, O., Elliott, W., Izquierdo, P., Patterson, D. J., & Butchart, S. H. M. (2023). A global assessment of the prevalence of current and potential future infrastructure in Key Biodiversity Areas. Biological Conservation, 281, 109953. https://doi.org/10.1016/j.biocon.2023.109953
Sims, M., Stanimirova, R., Neumann, M., Raichuk, A., & Purves, D. (2025). New Data Shows What's Driving Forest Loss Around the World. https://www.wri.org/insights/forest-loss-drivers-data-trends
Trademap. (2025). Trade Map. Trade Map. https://www.trademap.org/Index.aspx
UN DESA. (n.d.). Economic and Environmental Vulnerability Indicators. Retrieved January 26, 2026, from https://policy.desa.un.org/themes/least-developed-countries-category/ldc-identification-criteria-indicators/evi-indicators
UN DESA. (2025). 2024 Revision of World Population Prospects. https://population.un.org/wpp/
UN Energy Statistics. (2025). Energy Balance Visualization [Dataset]. https://unstats.un.org/unsd/energystats/dataPortal/
UNEP. (2021, May 12). Domestic material consumption (DMC) and DMC per capita, per GDP (Tier I). https://www.unep.org/indicator-1222
Weiss, D. J., Nelson, A., Gibson, H. S., Temperley, W., Peedell, S., Lieber, A., Hancher, M., Poyart, E., Belchior, S., Fullman, N., Mappin, B., Dalrymple, U., Rozier, J., Lucas, T. C. D., Howes, R. E., Tusting, L. S., Kang, S. Y., Cameron, E., Bisanzio, D., … Gething, P. W. (2018). A global map of travel time to cities to assess inequalities in accessibility in 2015. Nature, 553(7688), 333-336. https://doi.org/10.1038/nature25181
WHO. (2023). Global Status Report on Road Safety 2023. https://www.who.int/teams/social-determinants-of-health/safety-and-mobility/global-status-report-on-road-safety-2023
Wiedenhofer, D., Baumgart, A., Matej, S., Virág, D., Kalt, G., Lanau, M., Tingley, D. D., Liu, Z., Guo, J., Tanikawa, H., & Haberl, H. (2024). Mapping and modelling global mobility infrastructure stocks, material flows and their embodied greenhouse gas emissions [Dataset]. https://doi.org/10.1016/j.jclepro.2023.139742
World Bank. (2021). ICP 2021. https://databank.worldbank.org/source/icp-2021
World Bank. (2022a). Annual freshwater withdrawals, total (% of internal resources) [Dataset]. https://data.worldbank.org
World Bank. (2022b). Land area (sq. Km) [Dataset]. https://data.worldbank.org
World Bank. (2022c). The Global Health Cost of PM2.5 Air Pollution: A Case for Action Beyond 2021. The World Bank. https://doi.org/10.1596/978-1-4648-1816-5
World Bank. (2023). Forest area (% of land area) [Dataset]. https://data.worldbank.org/indicator/AG.LND.FRST.ZS
World Bank. (2024). Home | Logistics Performance Index (LPI). Logistics Performance Index. https://lpi.worldbank.org/
World Bank. (2025a). GDP per capita, PPP (current international $) [Dataset]. https://data.worldbank.org/indicator/NY.GDP.PCAP.PP.CD
World Bank. (2025b). GDP, PPP (current international $) [Dataset]. https://data.worldbank.org/indicator/NY.GDP.MKTP.PP.CD
World Database on Protected Areas. (2024). Protected Areas (WDPA) [Dataset]. https://www.protectedplanet.net/en/thematic-areas/wdpa?tab=WDPA