
Armenia Green Roads Profile 2025
ARMENIA
GREEN ROADS PROFILESupported by:
The ATO green roads profiles present country-level perspectives on how 35 Asia-Pacific economies are addressing the development and management of sustainable eco-friendly roads. Drawing from diverse datasets and policy documents, the profiles highlight practices and measures that contribute to greener transport infrastructure.
Developed by the Asian Transport Observatory (ATO) in partnership with the International Road Federation (IRF), the profiles are designed to complement the Green Roads Toolkit. The toolkit provides a practical reference for integrating good practices across nine dimensions:
- Decarbonization
- Climate resilience
- Water and land management
- Pollution reduction
- Conserving biodiversity
- Responsible sourcing of materials
- Improving quality of life
- Disaster preparedness
- Fostering inclusive growth
This 2025 edition builds on earlier work to provide a comprehensive resource for guiding the planning, development, construction, and management of greener, more sustainable roads.
Background
Indicator - Dimension Matrix

Three million people spread across roughly 28,000 square kilometers in a landlocked terrain depend on an overwhelmingly local road network. Of the 27,500 kilometers of pavement crisscrossing Armenia, 92% serve rural and local needs; only 3% are classified as motorways or primary highways. This infrastructure density is 966 meters per square kilometer. Motorization is accelerating. With 221 vehicles per thousand people, Armenia still trails the Asia-Pacific average of 317, but the gap is closing. Since 2000, vehicle ownership has ticked upward, with users now commanding a fleet in which light-duty vehicles dominate the count, yet heavy-duty vehicles dictate the environmental toll.
Since 2000, economy-wide emissions grew at a manageable 2.6% annually. Road transport emissions, however, increased by 6.0%. The sector now accounts for all transport emissions and nearly a quarter of the entire economy's greenhouse gas output. According to the GAINS model, 87% of road transport CO2 comes from heavy-duty vehicles (HDVs). This is mainly due to the high distance to ports. While the economy's emissions intensity has improved drastically—reducing from 308 grams of CO2e per USD in 1990 to just 34 today—the absolute load continues to rise.
A distinct opportunity lies dormant in the power grid. Armenia's electricity is remarkably low-carbon, with a grid emission factor of 244 gCO2 per kWh, less than half the Asia-Pacific average of 559. The energy is ready for a transition, even if the fleet is not. Electric vehicle imports have reached $214 million over the last decade, now accounting for 16% of total vehicle imports by value. Yet, this influx is skewed; 86% of these are light-duty vehicles. The heavy trucks that choke the air and drive the emissions inventory remain largely untouched by electrification.
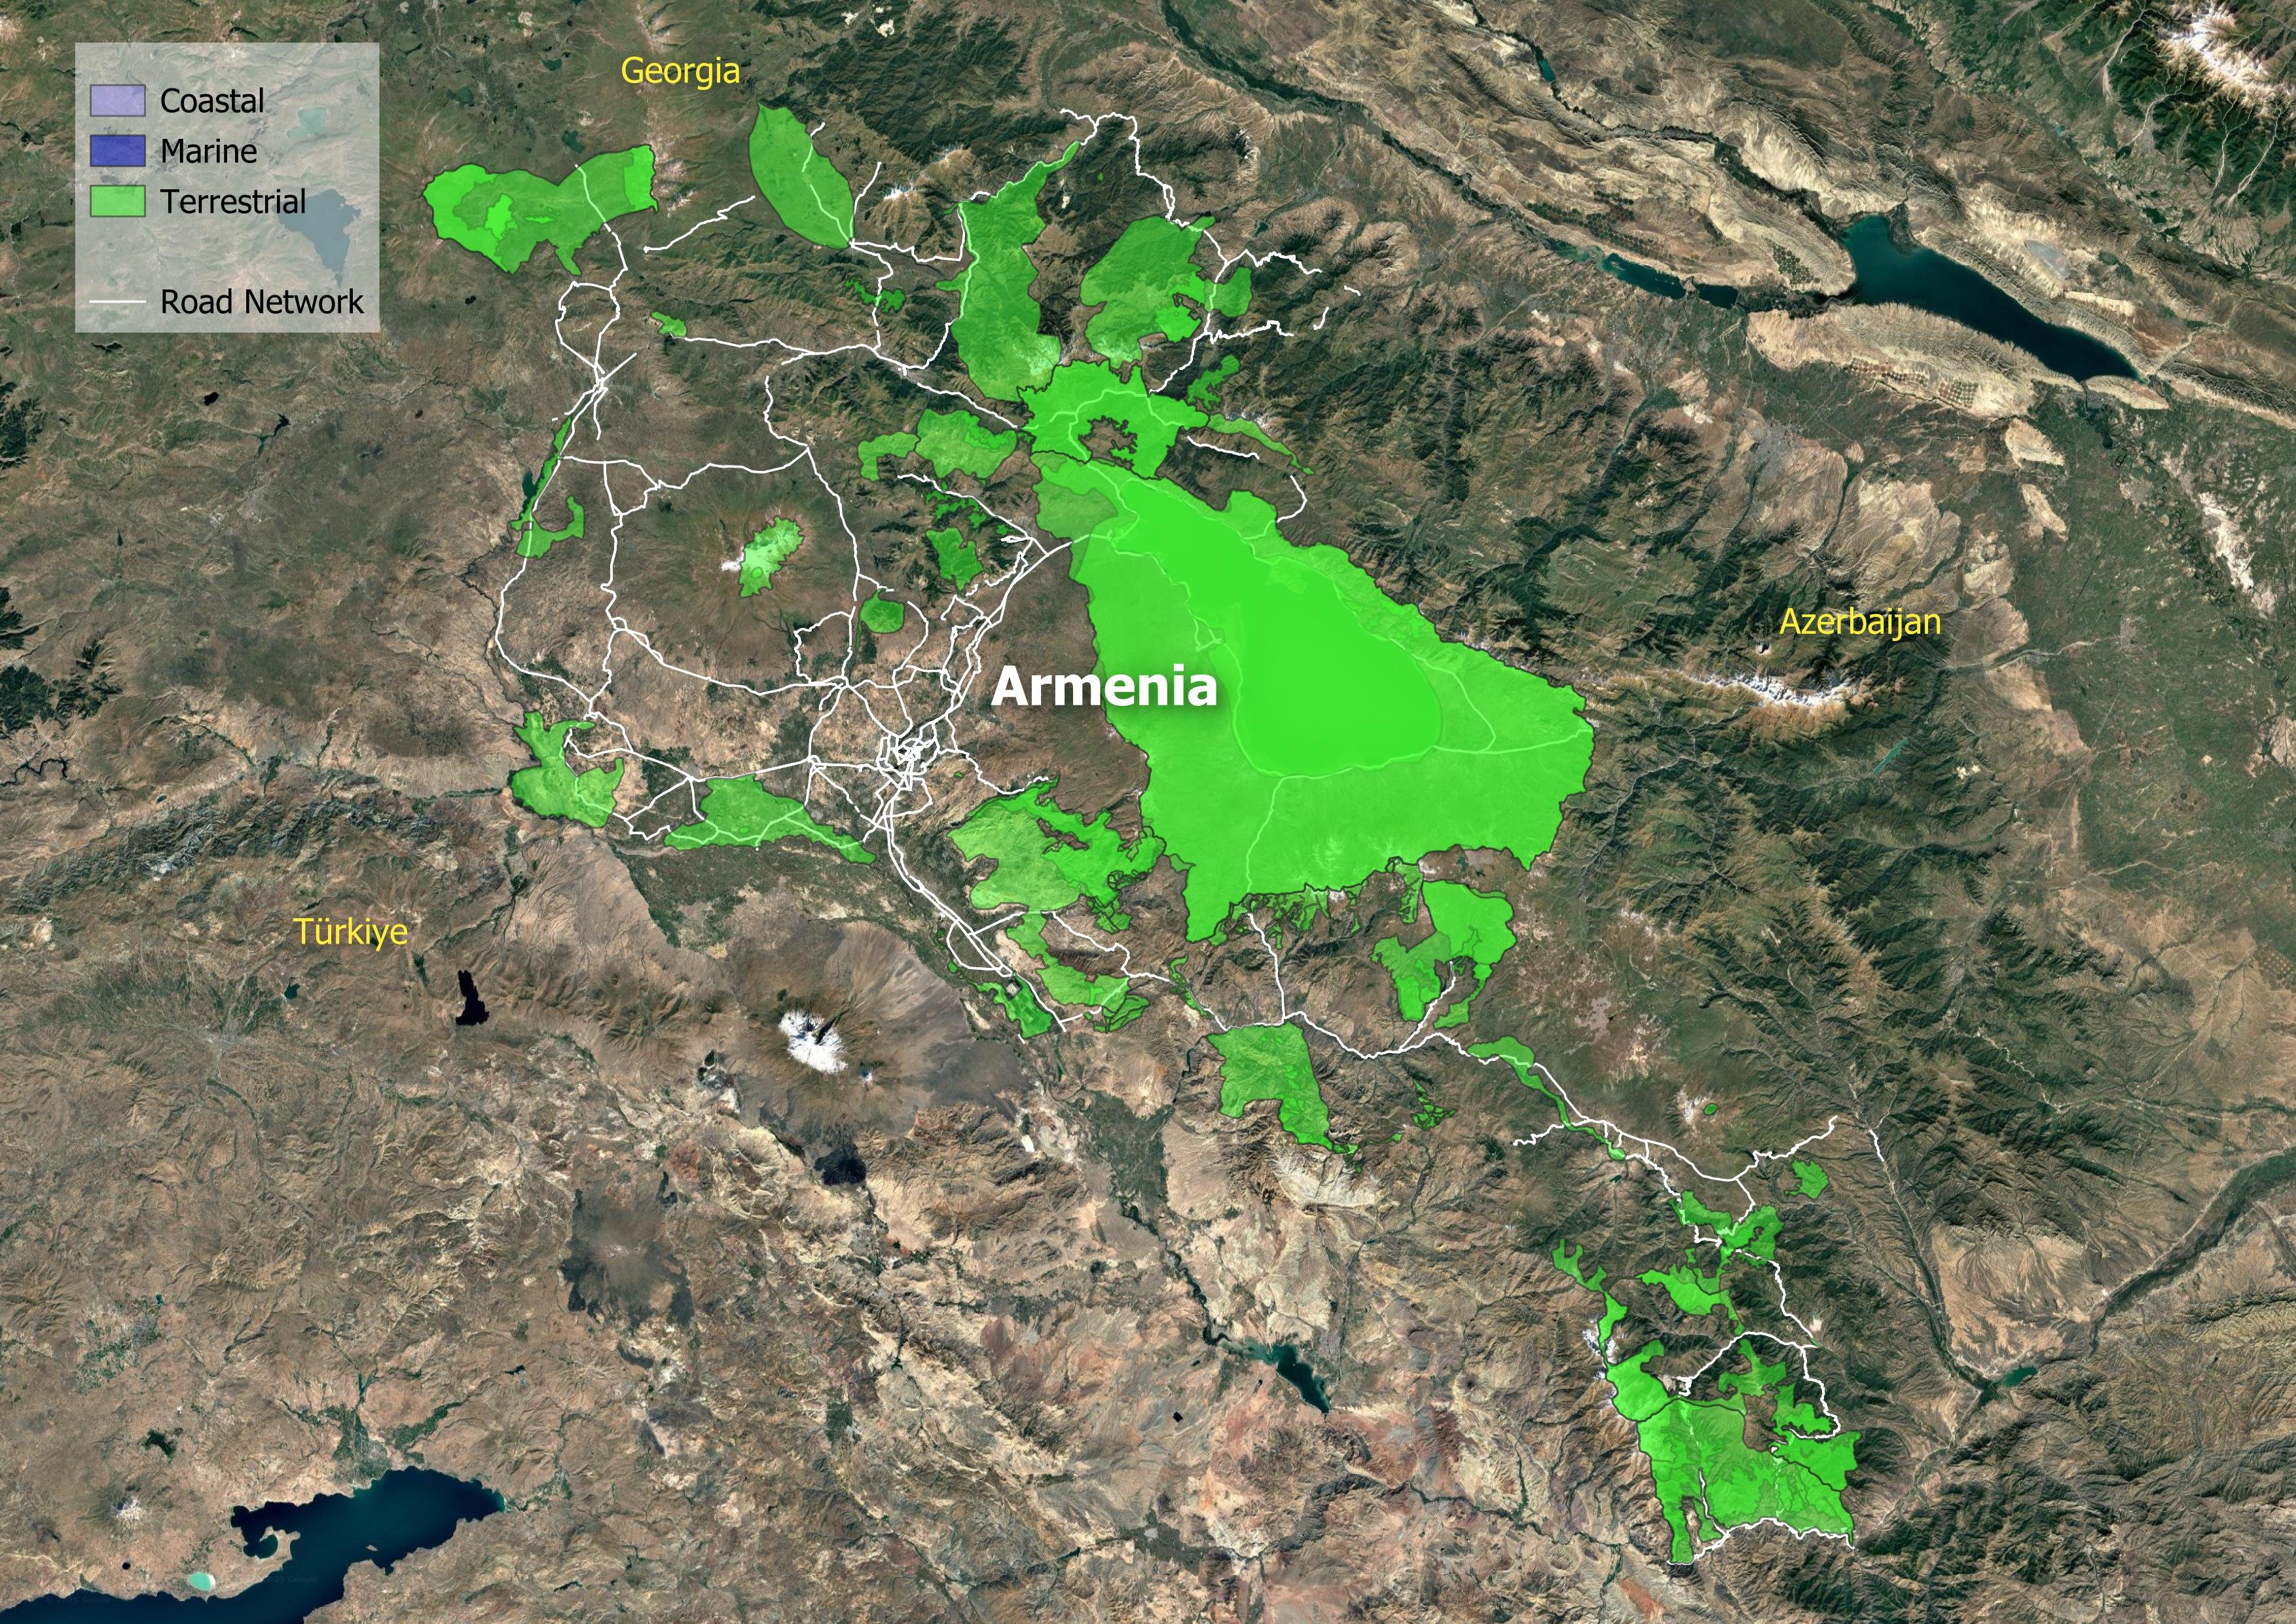
The road is also a vector for vulnerability. Climate stress is practically a line item in the national budget. Armenia faces average annual losses of $8.0 million to transport infrastructure, a figure that bridges and tunnels bear disproportionately. Under a 4.5-degree warming scenario, extreme precipitation will threaten 4% of road assets. The threat is not just to the road, but from it. Biodiversity suffers a heavy intrusion. Twenty-seven of Armenia's 28 Key Biodiversity Areas (KBAs) are dissected by infrastructure, equivalent to 359 meters of road per thousand square kilometers of protected land—four times the Asia-Pacific average.
Safety has improved, but at a slow pace. In Armenia, road crash fatalities decreased by approximately -5.4% per year between 2016 and 2021. However, this is not enough to reach the 2030 target to halve the fatalities by 2030. In 2021 alone, the roads claimed 379 lives. Beyond crashes, the air itself takes a heavy toll. Pollution from tailpipe emissions and dust adds to a health burden costing the economy about $4.5 billion each year—a staggering 11% of GDP. Transport makes up 6.8% of household spending in Armenia.
In urban centers, the car dictates movement; only 45% of city dwellers live safely away from highway pollution, and mass transit access reaches acceptable levels in only a third of agglomerations. Meanwhile, rural isolation persists, with 43,000 people cut off from all-season roads, leaving them without access to markets and healthcare.
Armenia stands at an uncertain junction. It possesses a low-carbon grid and a road network that reaches deep into its rural heartland. Yet, the current trajectory is one of rising emissions driven by freight, high external costs from crashes and congestion, and significant ecological fragmentation.
Decarbonization
Climate Resilience
Water and Land Management
Reducing Pollution
Preserving Biodiversity
Sustainable Materials Sourcing and Construction Practices
Improving Quality of life
Disaster Preparedness
Fostering Inclusive Growth
Supporting Information
Road Infrastructure Pipeline
| Armenia–Georgia Border Regional Road (M6 Vanadzor–Bagratashen) Improvement Project | 2016 | 62 million USD | 51.5 |
| North-South Corridor (Sisian-Kajaran) Road Project | 2024 | None | None |
| North–South Road Corridor Investment Program – Tranche 2 | 2010 | 210 million USD | 42 |
| North–South Road Corridor Investment Program – Tranche 3 | 2013 | 141.5 million USD | 46.2 |
| Preparing the Resilient and Inclusive Economic Corridor Improvement Project | 2024 | 0.75 million USD | None |
| Preparing Yerevan Urban Development Investment Project - II | 2023 | 0.7 million USD | None |
| Resilient and Inclusive Road Sector Improvement Project | 2024 | 370.07 million USD | None |
| Resilient and Inclusive Road Sector Improvement Project II | 2025 | None | None |
| North-South Corridor (Sisian-Kajaran) Road Project | 2024 | None | None |
| Yerevan Urban Development Investment Project | 2023 | 85.67 million USD | None |
Unit Cost Road Projects
Road Transport Policy Landscape
Road Transport Policy Targets
| THE 2021-2026 ACTION PLAN OF THE GOVERNMENT OF THE REPUBLIC OF ARMENIA (Annex No 1) | 2026 | At least 30% of specialists of the road sector will undergo training each year |
| Armenia Development Strategy for 2014-2025 | 2025 | Level of public investments in road system, % of GDP = 1 (2025) (Baseline, 2012 = 0.14) Level of public investments in transport sector (excluding road system), % of GDP = 0.15 (Baseline, 2012 = 0.14) Level of public expenditures on current and winter maintenance of roads having state and interstate status, % of GDP = 0.25 (Baseline, 2012 = 0.24) |
| Armenia Development Strategy for 2014-2025 | 2025 | Communities with at least one adequate road connecting them to the regional centre, % of total number of communities = 90 |
| Armenia Development Strategy for 2014-2025 | 2025 | Communities with at least one adequate road connecting them to the regional centre, % of total number of communities = 90 |
| Armenia Development Strategy for 2014-2025 | 2025 | Ratio of length of roads and segments in at least satisfactory condition to the overall length of roads of the same category, % = 65 Interstate = 100 State = 60 Local = 45 (Baseline %, 2012 = 39, 85, 34, 10) |
Road Transport Policy Measure Types
References
AIIB. (n.d.). MEASURING TRANSPORT CONNECTIVITY FOR TRADE IN ASIA. https://impact.economist.com/perspectives/sites/default/files/eco141_aiib_transport_connectivity_4.pdf/
Asian Transport Observatory. (2025). Asia and the Pacific's Transport Infrastructure and Investment Outlook 2035. https://asiantransportobservatory.org/analytical-outputs/asia-transport-infrastructure-investment-needs/
Barrington-Leigh, C., & Millard-Ball, A. (2025). A high-resolution global time series of street-network sprawl. https://journals.sagepub.com/doi/10.1177/23998083241306829
CDRI. (2023). Global Infrastructure Risk Model and Resilience Index. https://giri.unepgrid.ch/
CIESIN. (2023a). Rural Access Index [Dataset]. https://sedac.ciesin.columbia.edu/data/set/sdgi-9-1-1-rai-2023
CIESIN. (2023b). SDG Indicator 11.2.1: Urban Access to Public Transport, 2023 Release: Sustainable Development Goal Indicators (SDGI). https://sedac.ciesin.columbia.edu/data/set/sdgi-11-2-1-urban-access-public-transport-2023
EDGAR. (2025). GHG emissions of all world countries: 2025. Publications Office. https://data.europa.eu/doi/10.2760/9816914
Ember. (2024). Electricity Data Explorer [Dataset]. https://ember-energy.org/data/electricity-data-explorer
EM-DAT. (2025). EM-DAT - The international disaster database. https://www.emdat.be/European Commission. (2024). Global Air Pollutant Emissions EDGAR v8.1 [Dataset]. https://edgar.jrc.ec.europa.eu/dataset_ap61#sources
IEA. (n.d.). Fossil Fuel Subsidies. IEA. Retrieved April 19, 2025, from https://www.iea.org/topics/fossil-fuel-subsidies
ILO. (2025). ILOSTAT [Dataset]. https://rplumber.ilo.org/files/website/bulk/indicator.html
ITDP. (2024). The Atlas of Sustainable City Transport. https://atlas.itdp.org/
Koks, E., Rozenberg, J., Tariverdi, M., Dickens, B., Fox, C., Ginkel, K. van, & Hallegatte, S. (2023). A global assessment of national road network vulnerability. Environmental Research: Infrastructure and Sustainability, 3(2), 025008. https://doi.org/10.1088/2634-4505/acd1aa
Liu, K., Wang, Q., Wang, M., & Koks, E. E. (2023). Global transportation infrastructure exposure to the change of precipitation in a warmer world. Nature Communications, 14(1), 2541. https://doi.org/10.1038/s41467-023-38203-3
McDuffie, E. E., Martin, R. V., Spadaro, J. V., Burnett, R., Smith, S. J., O'Rourke, P., Hammer, M. S., van Donkelaar, A., Bindle, L., Shah, V., Jaeglé, L., Luo, G., Yu, F., Adeniran, J. A., Lin, J., & Brauer, M. (2021). Source sector and fuel contributions to ambient PM2.5 and attributable mortality across multiple spatial scales. Nature Communications, 12(1), 3594. https://doi.org/10.1038/s41467-021-23853-y
Parry, S. B., Antung A. Liu,Ian W. H. (2023). IMF Fossil Fuel Subsidies Data: 2023 Update. IMF. https://www.imf.org/en/publications/wp/issues/2023/08/22/imf-fossil-fuel-subsidies-data-2023-update-537281
Simkins, A. T., Beresford, A. E., Buchanan, G. M., Crowe, O., Elliott, W., Izquierdo, P., Patterson, D. J., & Butchart, S. H. M. (2023). A global assessment of the prevalence of current and potential future infrastructure in Key Biodiversity Areas. Biological Conservation, 281, 109953. https://doi.org/10.1016/j.biocon.2023.109953
Sims, M., Stanimirova, R., Neumann, M., Raichuk, A., & Purves, D. (2025). New Data Shows What's Driving Forest Loss Around the World. https://www.wri.org/insights/forest-loss-drivers-data-trends
Trademap. (2025). Trade Map. Trade Map. https://www.trademap.org/Index.aspx
UN DESA. (n.d.). Economic and Environmental Vulnerability Indicators. Retrieved January 26, 2026, from https://policy.desa.un.org/themes/least-developed-countries-category/ldc-identification-criteria-indicators/evi-indicators
UN DESA. (2025). 2024 Revision of World Population Prospects. https://population.un.org/wpp/
UN Energy Statistics. (2025). Energy Balance Visualization [Dataset]. https://unstats.un.org/unsd/energystats/dataPortal/
UNEP. (2021, May 12). Domestic material consumption (DMC) and DMC per capita, per GDP (Tier I). https://www.unep.org/indicator-1222
Weiss, D. J., Nelson, A., Gibson, H. S., Temperley, W., Peedell, S., Lieber, A., Hancher, M., Poyart, E., Belchior, S., Fullman, N., Mappin, B., Dalrymple, U., Rozier, J., Lucas, T. C. D., Howes, R. E., Tusting, L. S., Kang, S. Y., Cameron, E., Bisanzio, D., … Gething, P. W. (2018). A global map of travel time to cities to assess inequalities in accessibility in 2015. Nature, 553(7688), 333-336. https://doi.org/10.1038/nature25181
WHO. (2023). Global Status Report on Road Safety 2023. https://www.who.int/teams/social-determinants-of-health/safety-and-mobility/global-status-report-on-road-safety-2023
Wiedenhofer, D., Baumgart, A., Matej, S., Virág, D., Kalt, G., Lanau, M., Tingley, D. D., Liu, Z., Guo, J., Tanikawa, H., & Haberl, H. (2024). Mapping and modelling global mobility infrastructure stocks, material flows and their embodied greenhouse gas emissions [Dataset]. https://doi.org/10.1016/j.jclepro.2023.139742
World Bank. (2021). ICP 2021. https://databank.worldbank.org/source/icp-2021
World Bank. (2022a). Annual freshwater withdrawals, total (% of internal resources) [Dataset]. https://data.worldbank.org
World Bank. (2022b). Land area (sq. Km) [Dataset]. https://data.worldbank.org
World Bank. (2022c). The Global Health Cost of PM2.5 Air Pollution: A Case for Action Beyond 2021. The World Bank. https://doi.org/10.1596/978-1-4648-1816-5
World Bank. (2023). Forest area (% of land area) [Dataset]. https://data.worldbank.org/indicator/AG.LND.FRST.ZS
World Bank. (2024). Home | Logistics Performance Index (LPI). Logistics Performance Index. https://lpi.worldbank.org/
World Bank. (2025a). GDP per capita, PPP (current international $) [Dataset]. https://data.worldbank.org/indicator/NY.GDP.PCAP.PP.CD
World Bank. (2025b). GDP, PPP (current international $) [Dataset]. https://data.worldbank.org/indicator/NY.GDP.MKTP.PP.CD
World Database on Protected Areas. (2024). Protected Areas (WDPA) [Dataset]. https://www.protectedplanet.net/en/thematic-areas/wdpa?tab=WDPA