
Afghanistan Green Roads Profile 2025
AFGHANISTAN
GREEN ROADS PROFILESupported by:
The ATO green roads profiles present country-level perspectives on how 35 Asia-Pacific economies are addressing the development and management of sustainable eco-friendly roads. Drawing from diverse datasets and policy documents, the profiles highlight practices and measures that contribute to greener transport infrastructure.
Developed by the Asian Transport Observatory (ATO) in partnership with the International Road Federation (IRF), the profiles are designed to complement the Green Roads Toolkit. The toolkit provides a practical reference for integrating good practices across nine dimensions:
- Decarbonization
- Climate resilience
- Water and land management
- Pollution reduction
- Conserving biodiversity
- Responsible sourcing of materials
- Improving quality of life
- Disaster preparedness
- Fostering inclusive growth
This 2025 edition builds on earlier work to provide a comprehensive resource for guiding the planning, development, construction, and management of greener, more sustainable roads.
Background
Indicator - Dimension Matrix

Afghanistan is a paradox of geography and connectivity. Spread over 652,000 square kilometers, the nation houses 42.6 million people, yet faces significant access and connectivity challenge. The road network measures 177,700 kilometers. Most of this—91%—consists of local and rural tracks. Primary arteries are scarce. Road infrastructure density stands at 272 meters per square kilometer. Availability has risen, climbing from 1.9 kilometers per thousand people in 2000 to 4.2 kilometers in 2024, but the deficit remains acute. Motorization rates tell a story of suppressed mobility. There are 51 vehicles per thousand people. The Asia-Pacific average is 317.
Road transport greenhouse gas (GHG) emissions hit 3.5 million tonnes of CO2e in 2024. The trajectory is steep. Since 2000, sector emissions have increased by 14.4% annually. The broader economy grew its emissions by only 3.5%. Transport is outpacing development. Consequently, the sector now accounts for 86% of total transport emissions and 11% of the national aggregate. Efficiency is lagging. The emissions intensity of the road sector sits at 39 grams of CO2e per USD of GDP. The regional peers in Central and West Asia average 33; the broader Asia-Pacific sits at 26. Decoupling has not begun.
The fleet composition locks in this inefficiency. Light-duty vehicles dominate at 55%, while trucks make up 15%. The transition to electric mobility is non-existent. A UNEP E-mobility Readiness Index score of 39 out of 100 confirms the barrier: policy scores a mere 5, finance a 4.
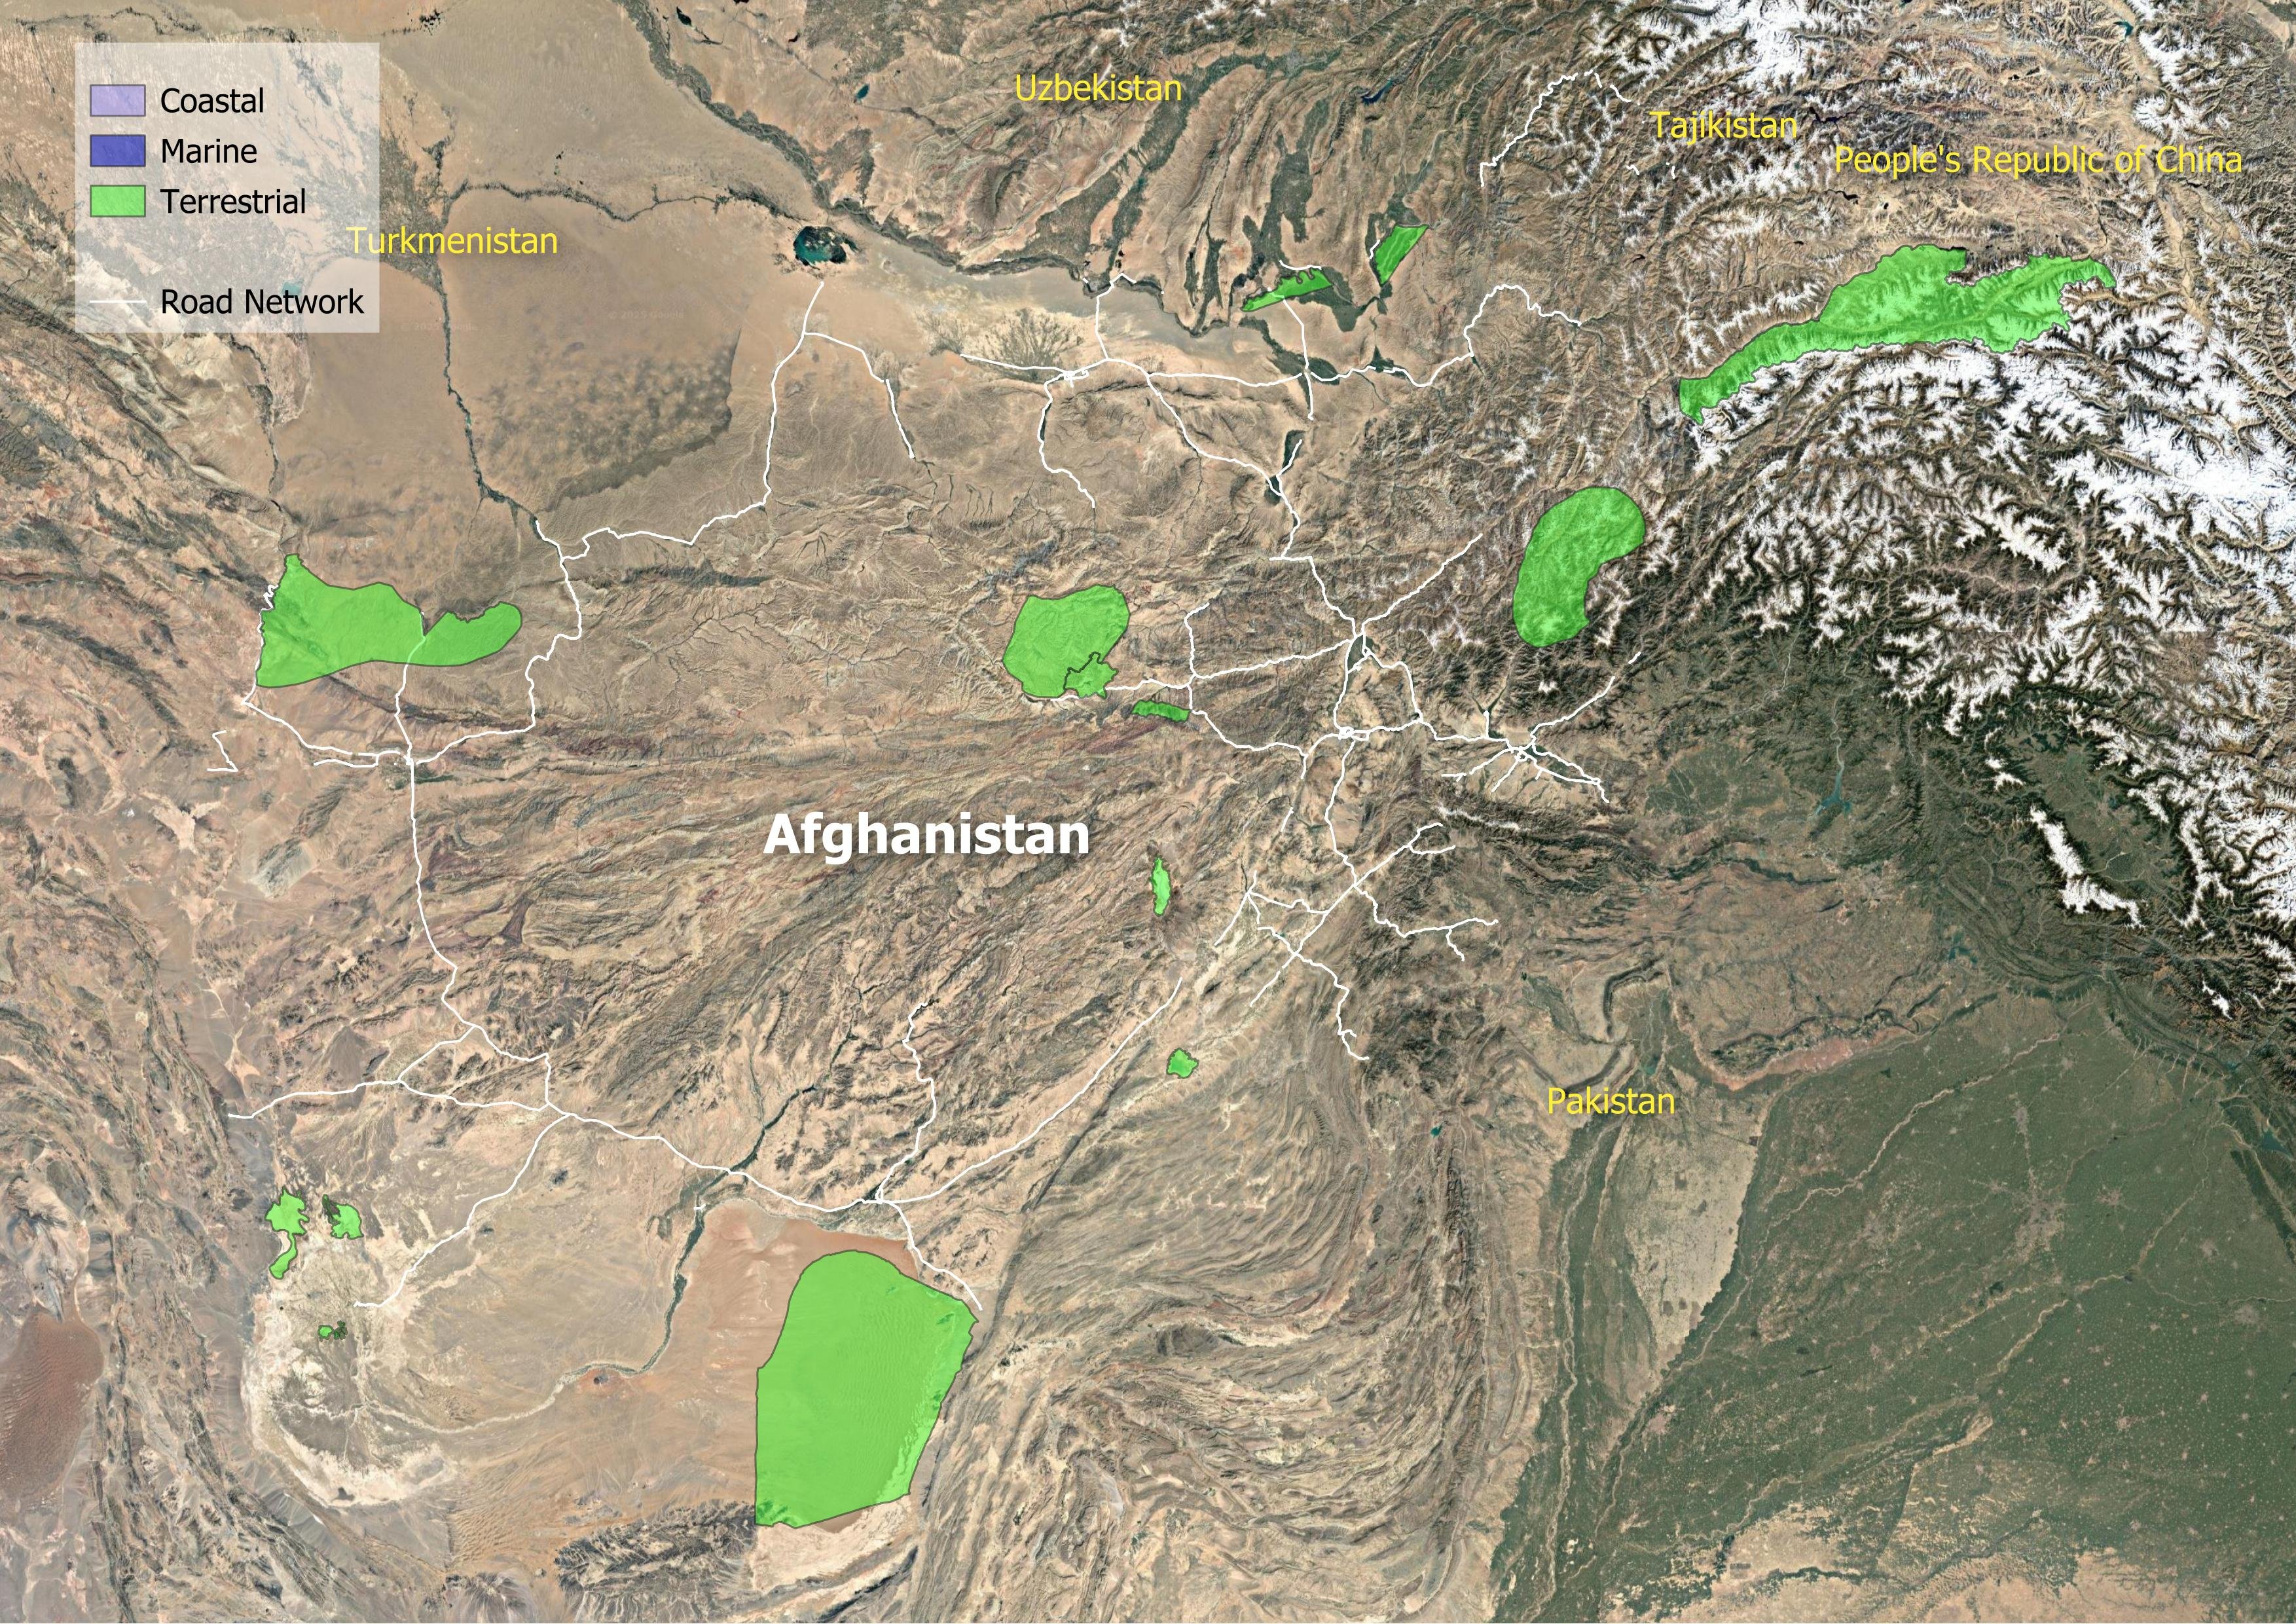
Nature bears the weight of this infrastructure. The roads cut through fragile lands. Of the 17 Key Biodiversity Areas (KBAs), 13 have been breached by road infrastructure. This equates to 8 meters of road per thousand square kilometers of protected ground. Water stress is concurrent. The nation extracts 55% of its renewable water, far above the regional average of 36%.
The air pollution is intense. The concentration of PM 2.5 hit 49.9 micrograms per cubic meter. The cost is paid in lives and currency. Tailpipe emissions claimed at least 496 premature lives. The economic loss from health damages linked to PM 2.5 exposure is estimated at $6.2 billion—roughly 7% of GDP.
Resilience is low. The network is brittle. Afghanistan ranks 54th out of 208 in the National Road Vulnerability Index. A single hazard can sever critical lifelines. Annual losses to transport infrastructure average $3.3 million. Bridges and tunnels, though a fraction of the length, absorb a disproportionate share of this damage. Under a 4.5-degree warming scenario, extreme precipitation threatens over 1% of road and rail assets. The danger is not theoretical. Since 2000, 156 disasters—mostly floods and landslides—have killed nearly 14,000 people.
Inequity defines access. 16.7 million rural residents live beyond the reach of an all-season road. They are cut off from markets, healthcare, and schools. In the cities, the situation is hardly better. In 43% of urban centers, only two out of ten residents have access to public transport. The logistics performance is improving, rising to rank 139 in 2023, yet network efficiency remains poor at 0.49 out of 1.0.
The sector excludes women almost entirely from the workforce. Of the 426,000 employed in transport operations, women comprise just 0.2%. Safety is another failure. Road crashes killed an estimated 9,684 people in 2021. In Afghanistan, road crash fatalities increased by approximately 6.4% per year between 2016 and 2021. If this pattern persists, the gap between current trends and the 2030 target will only widen. To halve fatalities by 2030, the rate must more than triple to 7.4%.
The baseline reveals a system defined by high friction and deep vulnerability. While the region pivots toward electrification and resilience, Afghanistan remains locked in a high-emission, low-access paradigm. Without an immediate structural shift in policy and finance, the road network will remain a barrier to development rather than its catalyst.
Decarbonization
Climate Resilience
Water and Land Management
Reducing Pollution
Preserving Biodiversity
Sustainable Materials Sourcing and Construction Practices
Improving Quality of life
Disaster Preparedness
Fostering Inclusive Growth
Supporting Information
Road Infrastructure Pipeline
| Afghanistan Ring Road (National Highway NH01) | 2003 | 1700 million USD | 2200 |
| Central Asia Regional Economic Cooperation Corridors 5 and 6 (Kabul-Jalalabad) Road and Border Services Improvement Project | 2022 | None | None |
| Kabul Ring Road Project | 2020 | 280 million USD | 120 |
| O&M Programs for National and Tertiary Roads | None | 160 million USD | None |
| Preparing the Salang Corridor Rehabilitation Project | 2016 | 31.37 million USD | 86 |
| Qaisar–Dari Bum Road Project | 2017 | 334 million USD | None |
| Road Asset Management Project | 2016 | 56.3 million USD | None |
Unit Cost Road Projects
Road Transport Policy Landscape
Road Transport Policy Targets
| Afghanistan Transport Sector Master Plan Update (2017-2036) | 2025 | By 2020: 150 km of major roads improved and 180 km of roads maintained; by 2025, additional 150 km improved and 180 km maintained |
Road Transport Policy Measure Types
References
AIIB. (n.d.). MEASURING TRANSPORT CONNECTIVITY FOR TRADE IN ASIA. https://impact.economist.com/perspectives/sites/default/files/eco141_aiib_transport_connectivity_4.pdf/
Asian Transport Observatory. (2025). Asia and the Pacific's Transport Infrastructure and Investment Outlook 2035. https://asiantransportobservatory.org/analytical-outputs/asia-transport-infrastructure-investment-needs/
Barrington-Leigh, C., & Millard-Ball, A. (2025). A high-resolution global time series of street-network sprawl. https://journals.sagepub.com/doi/10.1177/23998083241306829
CDRI. (2023). Global Infrastructure Risk Model and Resilience Index. https://giri.unepgrid.ch/
CIESIN. (2023a). Rural Access Index [Dataset]. https://sedac.ciesin.columbia.edu/data/set/sdgi-9-1-1-rai-2023
CIESIN. (2023b). SDG Indicator 11.2.1: Urban Access to Public Transport, 2023 Release: Sustainable Development Goal Indicators (SDGI). https://sedac.ciesin.columbia.edu/data/set/sdgi-11-2-1-urban-access-public-transport-2023
EDGAR. (2025). GHG emissions of all world countries: 2025. Publications Office. https://data.europa.eu/doi/10.2760/9816914
Ember. (2024). Electricity Data Explorer [Dataset]. https://ember-energy.org/data/electricity-data-explorer
EM-DAT. (2025). EM-DAT - The international disaster database. https://www.emdat.be/European Commission. (2024). Global Air Pollutant Emissions EDGAR v8.1 [Dataset]. https://edgar.jrc.ec.europa.eu/dataset_ap61#sources
IEA. (n.d.). Fossil Fuel Subsidies. IEA. Retrieved April 19, 2025, from https://www.iea.org/topics/fossil-fuel-subsidies
ILO. (2025). ILOSTAT [Dataset]. https://rplumber.ilo.org/files/website/bulk/indicator.html
ITDP. (2024). The Atlas of Sustainable City Transport. https://atlas.itdp.org/
Koks, E., Rozenberg, J., Tariverdi, M., Dickens, B., Fox, C., Ginkel, K. van, & Hallegatte, S. (2023). A global assessment of national road network vulnerability. Environmental Research: Infrastructure and Sustainability, 3(2), 025008. https://doi.org/10.1088/2634-4505/acd1aa
Liu, K., Wang, Q., Wang, M., & Koks, E. E. (2023). Global transportation infrastructure exposure to the change of precipitation in a warmer world. Nature Communications, 14(1), 2541. https://doi.org/10.1038/s41467-023-38203-3
McDuffie, E. E., Martin, R. V., Spadaro, J. V., Burnett, R., Smith, S. J., O'Rourke, P., Hammer, M. S., van Donkelaar, A., Bindle, L., Shah, V., Jaeglé, L., Luo, G., Yu, F., Adeniran, J. A., Lin, J., & Brauer, M. (2021). Source sector and fuel contributions to ambient PM2.5 and attributable mortality across multiple spatial scales. Nature Communications, 12(1), 3594. https://doi.org/10.1038/s41467-021-23853-y
Parry, S. B., Antung A. Liu,Ian W. H. (2023). IMF Fossil Fuel Subsidies Data: 2023 Update. IMF. https://www.imf.org/en/publications/wp/issues/2023/08/22/imf-fossil-fuel-subsidies-data-2023-update-537281
Simkins, A. T., Beresford, A. E., Buchanan, G. M., Crowe, O., Elliott, W., Izquierdo, P., Patterson, D. J., & Butchart, S. H. M. (2023). A global assessment of the prevalence of current and potential future infrastructure in Key Biodiversity Areas. Biological Conservation, 281, 109953. https://doi.org/10.1016/j.biocon.2023.109953
Sims, M., Stanimirova, R., Neumann, M., Raichuk, A., & Purves, D. (2025). New Data Shows What's Driving Forest Loss Around the World. https://www.wri.org/insights/forest-loss-drivers-data-trends
Trademap. (2025). Trade Map. Trade Map. https://www.trademap.org/Index.aspx
UN DESA. (n.d.). Economic and Environmental Vulnerability Indicators. Retrieved January 26, 2026, from https://policy.desa.un.org/themes/least-developed-countries-category/ldc-identification-criteria-indicators/evi-indicators
UN DESA. (2025). 2024 Revision of World Population Prospects. https://population.un.org/wpp/
UN Energy Statistics. (2025). Energy Balance Visualization [Dataset]. https://unstats.un.org/unsd/energystats/dataPortal/
UNEP. (2021, May 12). Domestic material consumption (DMC) and DMC per capita, per GDP (Tier I). https://www.unep.org/indicator-1222
Weiss, D. J., Nelson, A., Gibson, H. S., Temperley, W., Peedell, S., Lieber, A., Hancher, M., Poyart, E., Belchior, S., Fullman, N., Mappin, B., Dalrymple, U., Rozier, J., Lucas, T. C. D., Howes, R. E., Tusting, L. S., Kang, S. Y., Cameron, E., Bisanzio, D., … Gething, P. W. (2018). A global map of travel time to cities to assess inequalities in accessibility in 2015. Nature, 553(7688), 333-336. https://doi.org/10.1038/nature25181
WHO. (2023). Global Status Report on Road Safety 2023. https://www.who.int/teams/social-determinants-of-health/safety-and-mobility/global-status-report-on-road-safety-2023
Wiedenhofer, D., Baumgart, A., Matej, S., Virág, D., Kalt, G., Lanau, M., Tingley, D. D., Liu, Z., Guo, J., Tanikawa, H., & Haberl, H. (2024). Mapping and modelling global mobility infrastructure stocks, material flows and their embodied greenhouse gas emissions [Dataset]. https://doi.org/10.1016/j.jclepro.2023.139742
World Bank. (2021). ICP 2021. https://databank.worldbank.org/source/icp-2021
World Bank. (2022a). Annual freshwater withdrawals, total (% of internal resources) [Dataset]. https://data.worldbank.org
World Bank. (2022b). Land area (sq. Km) [Dataset]. https://data.worldbank.org
World Bank. (2022c). The Global Health Cost of PM2.5 Air Pollution: A Case for Action Beyond 2021. The World Bank. https://doi.org/10.1596/978-1-4648-1816-5
World Bank. (2023). Forest area (% of land area) [Dataset]. https://data.worldbank.org/indicator/AG.LND.FRST.ZS
World Bank. (2024). Home | Logistics Performance Index (LPI). Logistics Performance Index. https://lpi.worldbank.org/
World Bank. (2025a). GDP per capita, PPP (current international $) [Dataset]. https://data.worldbank.org/indicator/NY.GDP.PCAP.PP.CD
World Bank. (2025b). GDP, PPP (current international $) [Dataset]. https://data.worldbank.org/indicator/NY.GDP.MKTP.PP.CD
World Database on Protected Areas. (2024). Protected Areas (WDPA) [Dataset]. https://www.protectedplanet.net/en/thematic-areas/wdpa?tab=WDPA