Filename: Slowing_Not_Yet_Falling_Transport_Emissions_in_Asia_and_the_Pacific.pdf
Filesize: 8.5 MB
Downloads: 26
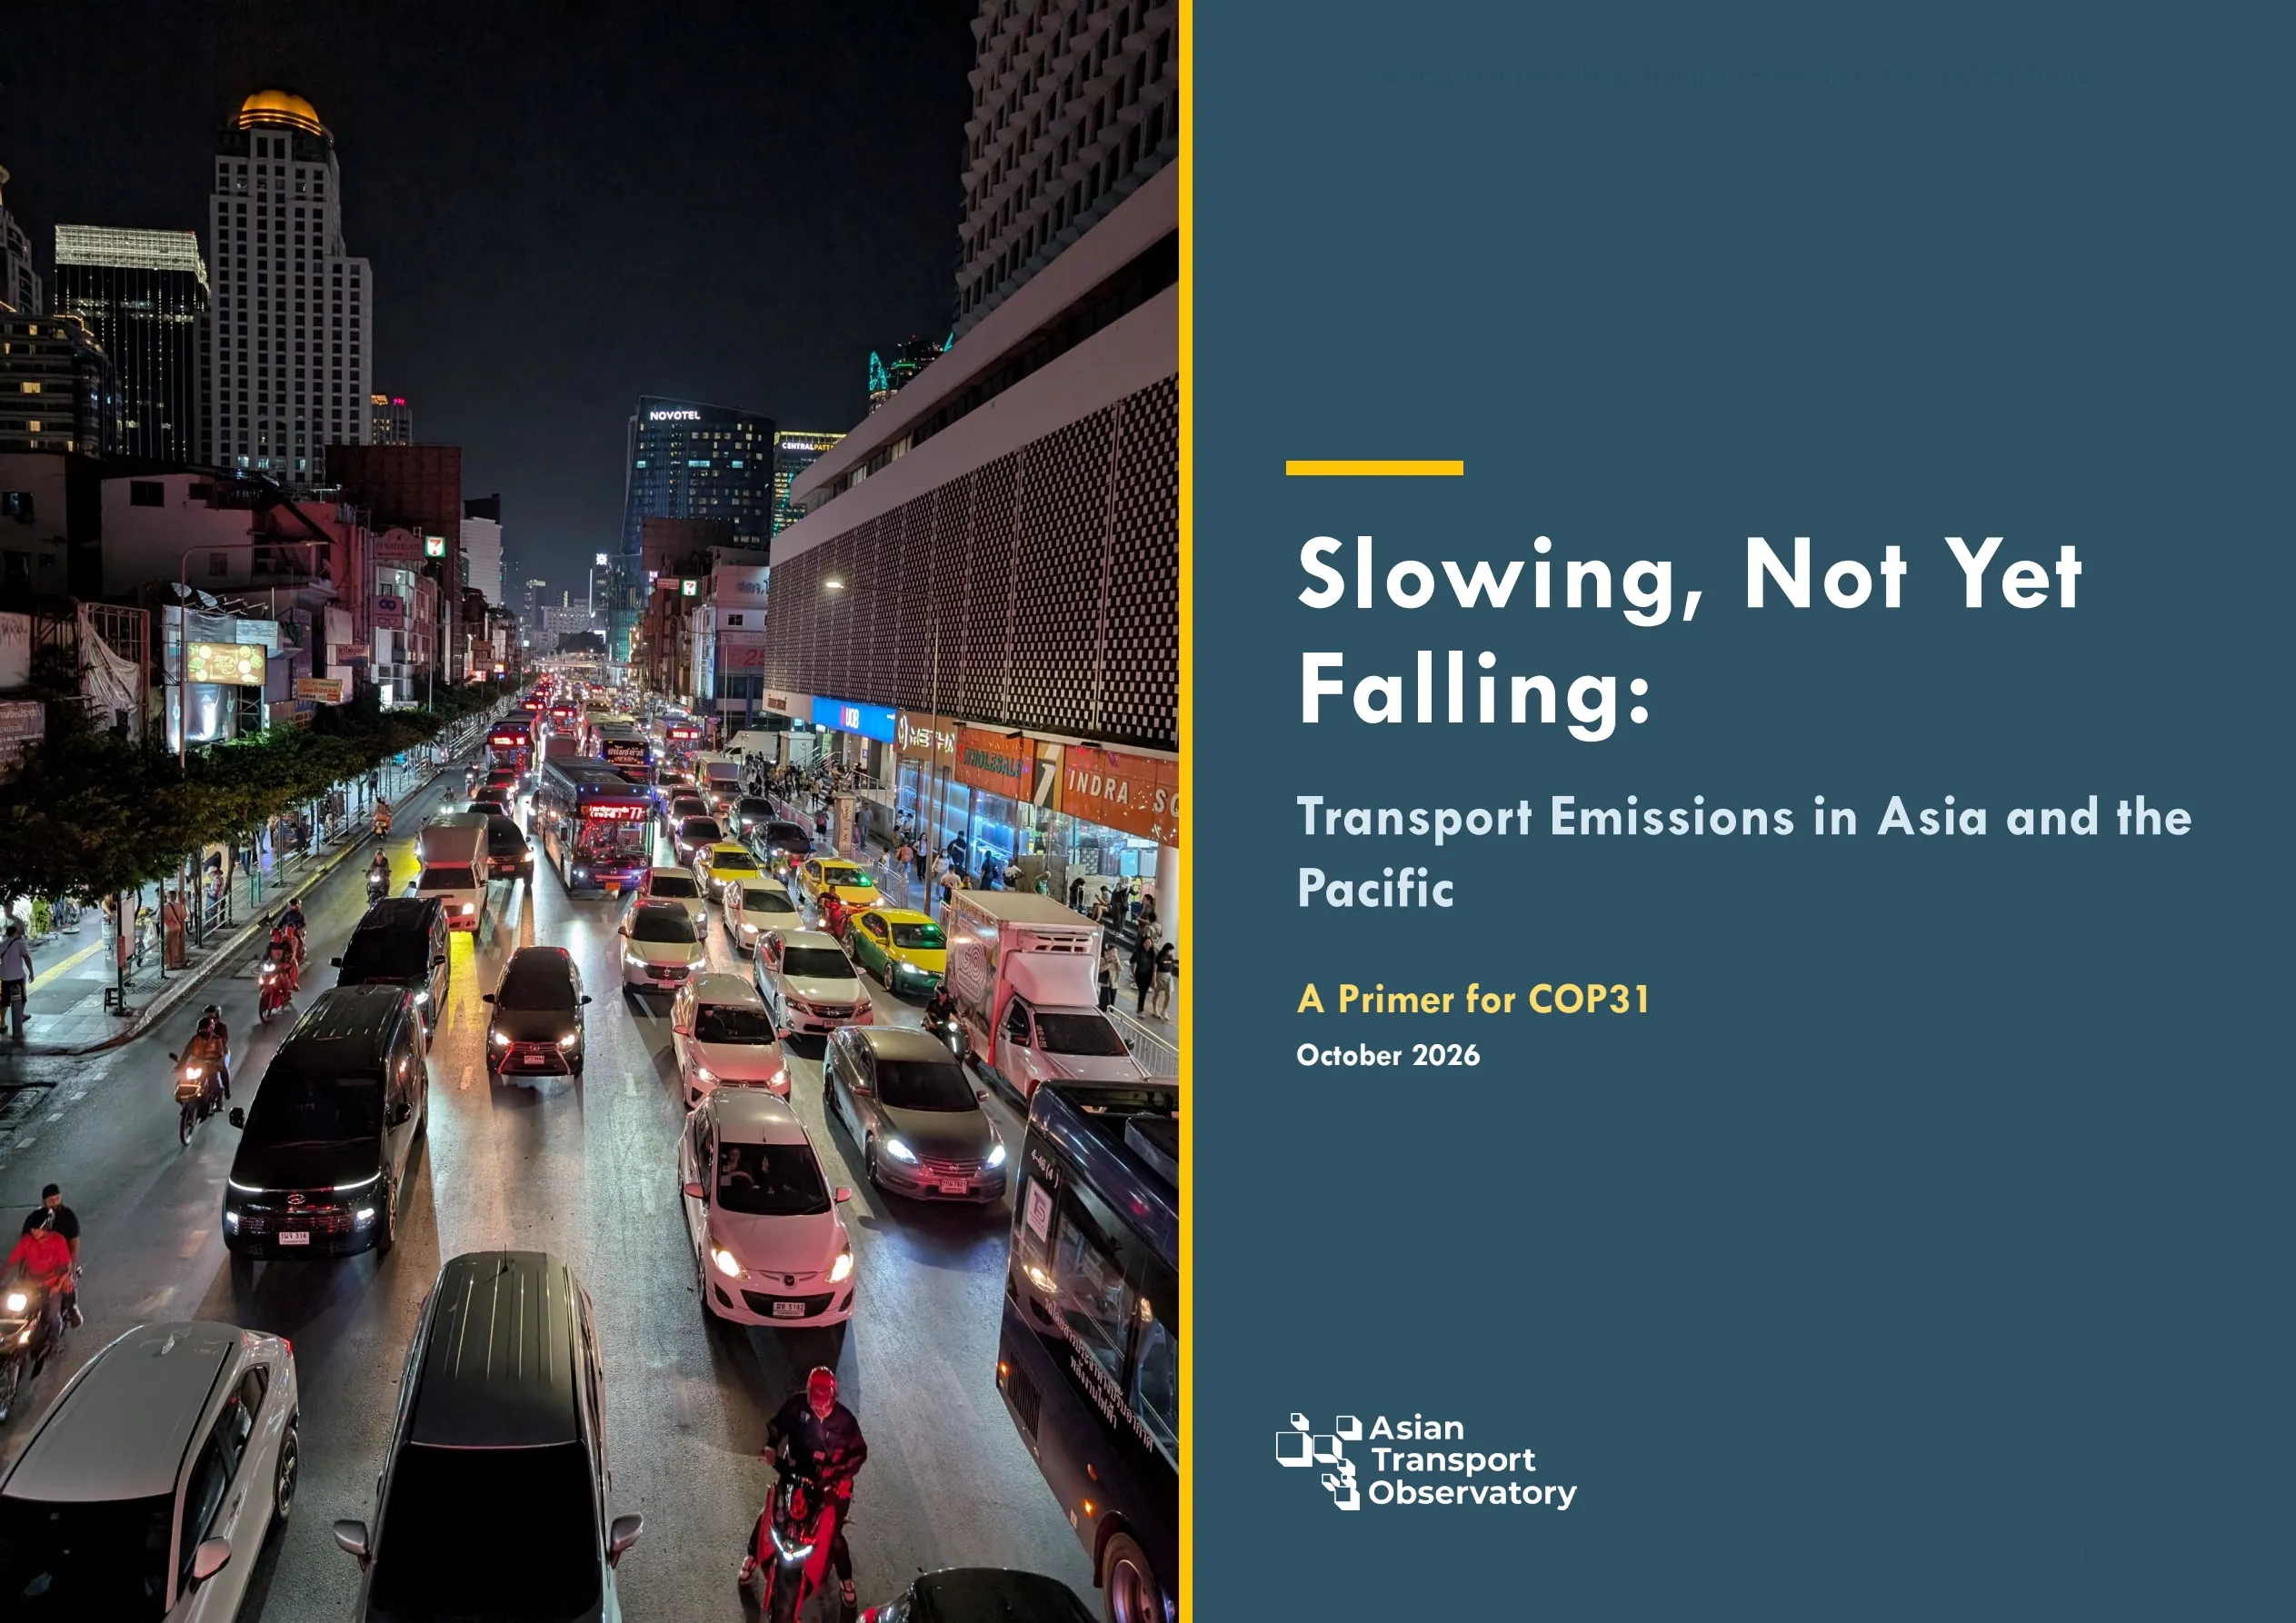
MetadataTransport emissions in Asia and the Pacific are still rising. But the curve is bending.
This primer updates the Asian Transport Observatory’s earlier brief for COP30. It adds a year of data and an oil shock. The picture is better than it was. It is not yet good enough.
What the data show
Growth has slowed. Annual growth in the region’s transport emissions fell from 4.1% in the 15 years to 2015 to 2.2% after the Paris Agreement. Before 2015, two-thirds of Asian economies recorded high or very high growth. Now it is about a third. The gains are uneven. East Asia cut its annual growth from 4.2% to 1.8%. Central and West Asia moved from 4.1% to only 3.7%.
The region still sets the global pace. Domestic transport in Asia and the Pacific emitted 3 billion tons of greenhouse gases in 2025, 9% more than Europe and North America combined. Asia supplied nearly 87% of the global increase since Paris. Its share of world transport emissions rose from 37% in 2015 to 42% in 2025. Yet transport is not what is driving Asia’s emissions. It makes up 9.3% of the region’s total, the lowest share in the world, against 26% in Europe and North America. The power sector is growing faster. Transport has not taken a larger slice of the carbon budget as incomes have risen. That breaks with the historical pattern in developed regions.
Where emissions come from
Road transport produced about 88% of the sector’s emissions in 2025, so road is where progress counts most. Electric vehicles took 53% of new car sales in the People’s Republic of China. Other economies are catching up. But the carbon saved depends on the grid, and transport has the lowest renewable share of any end-use sector: about 6% of final energy in 2023, up from 4% in 2015.
The other modes are moving at different speeds:
- Biofuels are rising from a small base. Five economies account for about 90% of the region’s biofuel emissions.
- Railway emissions grew 2.4% a year from 2015 to 2025, up from 0.7% a year between 2000 and 2015.
- Domestic aviation is 0.6% of the region’s emissions, but it grows faster than any other major energy-consuming sector.
- Domestic shipping has partly decoupled from economic growth. The People’s Republic of China still produces nearly two-thirds of its emissions.
- Private vehicle use rose in 207 of the 224 cities sampled. About 1.4 billion urban residents have no access to public transport.
Ambition is ahead of accountability
In 2015, less than 1% of the region’s people lived in countries with ambitious long-term climate goals. By 2026, the share was 87%. Few of the economies reviewed, though, set quantified transport targets in their latest nationally determined contributions. Adaptation is largely absent from those pledges. The region carries 65% of the expected annual damage to transport infrastructure worldwide. Finance is narrow, too. It is concentrated in a few economies and largely tied to rail loans.
Energy security changes the argument
The oil shock after the outbreak of conflict in the Middle East in February 2026 has made transport decarbonization an energy security issue as much as a climate one. Governments have reacted differently. Several oil-importing economies in Southeast Asia offered tax breaks for electric vehicles and funded fleet electrification. Several Central Asian countries raised fossil fuel subsidies.
Can emissions peak before 2030?
The evidence does not yet show it. Demand for passenger and freight transport could double or even quadruple between 2020 and 2050, and Asia could account for about half of the global increase. Pathways that limit warming to 1.5°C need global emissions to fall 43% from 2019 levels by 2030. Japan, a clear case of decoupling, was 10% below 2019 levels in 2025.
Still, the trend offers some room. Transport emissions per unit of GDP fell by 4.8% a year from 2015 to 2025. If that continues, regional emissions could peak in the early 2030s. If decoupling speeds up, a peak before 2030 is possible. Subregions differ sharply. In Central and West Asia, emissions could be 83% above 2015 levels by 2035, with no peak in sight.
About this publication
Contributors: Sudhir Gota, Alvin Mejia, Mel Eden, Aaron Salang, Benjamin Soco, Shubham Maheshwari.
Prepared in coordination with the Climate Compatible Growth (CCG) programme. The Asian Transport Observatory is initiated by ADB and supported under ADB technical assistance TA 10406-REG. The Asian Infrastructure Investment Bank (AIIB) also supports ATO.
Suggested citation: Asian Transport Observatory. 2026. Slowing, Not Yet Falling: Transport Emissions in Asia and the Pacific. A Primer for COP31. October. https://hdl.handle.net/20.500.14706/01.029.00